Zalando (ZAL.DE) stock forecast 2027–2029
What is the Zalando (ZAL.DE) stock forecast?
Our forecast for Zalando
€25.96by November 2027
€45.01by November 2029
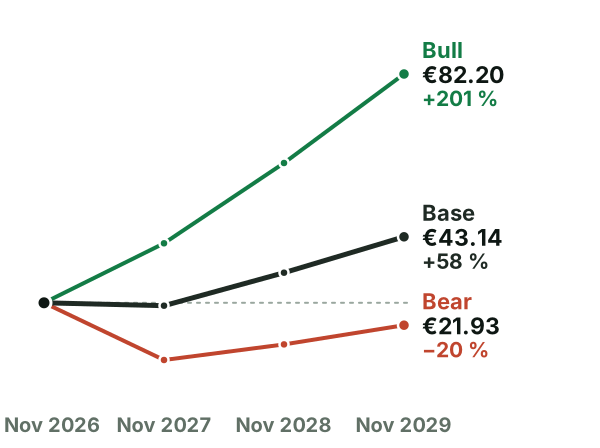
From €27.30 at the November 9, 2026 close, that is a 5 % loss by 2027 and a 65 % gain by 2029, dividends included.
It blends three cases for November 2027, € per share:
- Bear13.5828 % chance
- Base26.6252 % chance
- Bull41.5920 % chance
Our own forecast, built from Zalando's filings. It is not an average of analysts' price targets, so it can differ from them.
New accounts get one company's ready report free. No card.
Executive summary + 8 chapters · 20,202 words · 224 sources
Where could Zalando's shares be in 2027 and 2029?
Our probability-weighted price is €25.96 in November 2027, a 5% loss, and €45.01 in November 2029, a 65% return. Returns include dividends. Bear, base and bull probabilities are 28%, 52% and 20%.
What has to go right or wrong for Zalando?
Operating profit is the central driver. The base case rises from €480m in November 2027 to €650m in November 2029 as revenue growth settles and integration benefits improve margins. It assumes measured progress above the historical margin anchor, supported by €100m of targeted annual synergies by 2028, but restrained by price investment and fulfilment costs.
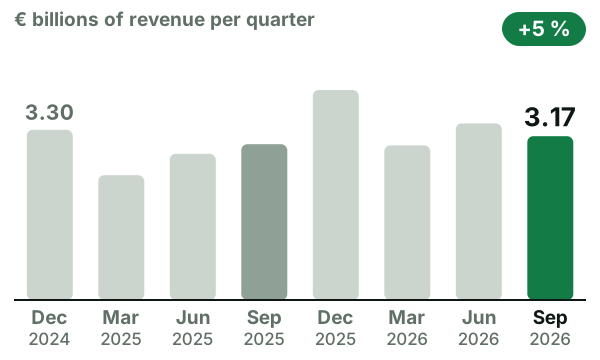
The bear case gives €300m to €450m because the September 2026 quarter produced only €13.1m of operating income on €3,174.7m of revenue. The bull case gives €620m to €930m because customer growth, ABOUT YOU demand and B2B utilisation could reinforce one another.
The forecast's table · base case, then bear / bull in brackets; EUR millions, per share in EUR, unless shown · November 2027
- Normal operating profit480 (300 / 620)
- Shares (millions)248 (252 / 243)
- Dividends per share0.00 (0.00 / 0.00)
- Enterprise value to normal operating profit11.00 (8.00 / 14.00)
- Net debt-1,311 (-1,018 / -1,431)
Bull case, 20 % chance: if it goes right
€82.20 by November 2029, +201 % with dividends.
Bear case, 28 % chance: if it goes wrong
€21.93 by November 2029, −20 % with dividends.
How much cash does Zalando really make?
Zalando’s own free-cash-flow measure was negative in 2025 because it included acquisition payments and spending on intangible assets. A stricter operating calculation can begin with operating cash, subtract physical capital spending and lease payments, then treat stock-based pay as an economic cost. It should also consider cash spent on internally developed software, although the accounts do not separate maintenance spending from growth spending.
What does an investor pay for Zalando today?
The P/E ratio compares the share price with profit per share. Zalando traded at 113.8 times its previous 12 months’ earnings but 14.6 times expected earnings for the next 12 months. The price is the same in both calculations; the assumed profit changes. The forward multiple therefore describes a recovery that has not yet appeared in reported earnings.
Zalando earnings: how did the last quarter go?
Questions about Zalando (ZAL.DE) stock
Where will Zalando stock be in 5 years?
Our report's forecast goes to November 2029. By then it puts the shares between €21.93 in the bear case and €82.20 in the bull case, and at €45.01 with the three cases weighted by their chances. It makes no forecast past November 2029.
Who are Zalando's competitors?
Our report compares Zalando with M&S and Amazon.
Why is this forecast different from analysts' price targets?
Analysts' price targets average the share prices that brokerage analysts expect. Our report builds its own three cases from Zalando's filings, gives each a chance and counts dividends.
More on Zalando (ZAL.DE)
More Zalando pages
Zalando's own filings
This page gives the forecast. The report gives the reasons.
The full report: an executive summary and 8 chapters, 20,202 words, 53 tables. Its first page opens here, no account needed.
How it is made: AI reads Zalando's filings, writes the report, checks the numbers against them and cites each source, 224 in this one. How we work · Corrections
Read Zalando's full report freeNew accounts get one company's ready report free. No card.
Information only, not investment advice. The forecast gives three cases with their chances; it promises no price. Prices are those of the date shown.