Capgemini (CAP.PA) stock forecast 2027–2029
What is the Capgemini (CAP.PA) stock forecast?
Our forecast for Capgemini
€207.32by November 2027
€244.96by November 2029
From €123.65 at the November 10, 2026 close, that is a 70 % gain by 2027 and 107 % by 2029, dividends included.
It blends three cases for November 2027, € per share:
- Bear14930 % chance
- Base21855 % chance
- Bull28615 % chance
Our own forecast, built from Capgemini's filings. It is not an average of analysts' price targets, so it can differ from them.
New accounts get one company's ready report free. No card.
Executive summary + 8 chapters · 22,207 words · 148 sources
Where could Capgemini’s shares be in November 2027 and November 2029?
Our scenario-weighted price is €207.32 in November 2027, a 70% return, and €244.96 in November 2029, a 107% return. Returns include dividends. The probabilities are 30% bear, 55% base and 15% bull.
What has to go right or wrong for Capgemini’s stock forecast?
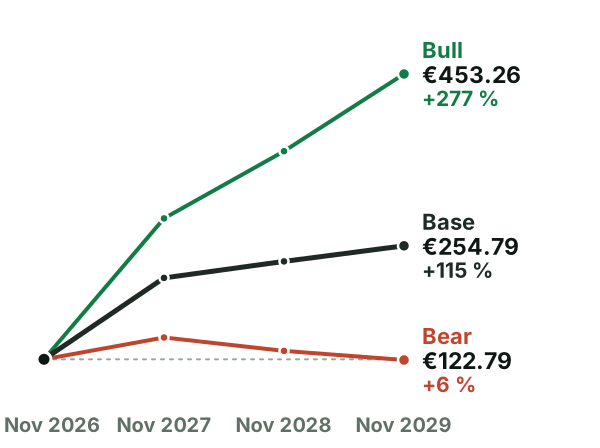
The bear case keeps earnings near €2.1 billion because revenue growth weakens and margins fall from 8.5% to 8.2%. It assumes first-horizon revenue of €24,700 million and only about 2% annual growth thereafter. The evidence is the Q3 book-to-bill of 0.89 and net debt of €6,454 million. The bull case reaches €3,282 million, beginning at €2,630 million, because stronger bookings, repeatable AI work and WNS cross-selling support 8% growth and margins rising from 10.0% to 10.7%.
The forecast's table · base case, then bear / bull in brackets; EUR millions, per share in EUR, unless shown · November 2027
- Earnings2,431 (2,100 / 2,630)
- Shares (millions)168 (169 / 165)
- Dividends per share3.50 (2.80 / 3.80)
- Price to earnings15.00 (12.00 / 18.00)
Bull case, 15 % chance: if it goes right
€453.26 by November 2029, +277 % with dividends.
Bear case, 30 % chance: if it goes wrong
€122.79 by November 2029, +6 % with dividends.
How much cash does Capgemini really make?
After capital spending, lease payments and interest, the supplied free-cash-flow calculation was €1,731 million, against net income of €1,601 million. Capgemini’s organic free cash flow is its own measure and was €1,949 million in 2025.
Share-based compensation expense was €245 million in 2025. A separate supplied calculation deducts €223 million of stock pay, leaving €1,508 million. The two stock-pay figures are different measures, but both show why cash generation is not the whole economic cost of employee compensation.
What does an investor pay for Capgemini today?
P/E, or price-to-earnings, compares the share price with earnings per share. Trailing P/E uses the past twelve months; forward P/E uses a forecast, so the latter is an expectation rather than a fact. “Normalized” earnings remove items such as restructuring, acquisition costs, and amortization of acquired intangible assets. In 2025, basic EPS was €9.46 while normalized EPS was €12.95, making the choice of earnings measure material.
Capgemini earnings: how did the last quarter go?
Questions about Capgemini (CAP.PA) stock
Where will Capgemini stock be in 5 years?
Our report's forecast goes to November 2029. By then it puts the shares between €122.79 in the bear case and €453.26 in the bull case, and at €244.96 with the three cases weighted by their chances. It makes no forecast past November 2029.
Who are Capgemini's competitors?
Our report compares Capgemini with Accenture, IBM and Cognizant.
Why is this forecast different from analysts' price targets?
Analysts' price targets average the share prices that brokerage analysts expect. Our report builds its own three cases from Capgemini's filings, gives each a chance and counts dividends.
More on Capgemini (CAP.PA)
This page gives the forecast. The report gives the reasons.
The full report: an executive summary and 8 chapters, 22,207 words, 56 tables. Its first page opens here, no account needed.
How it is made: AI reads Capgemini's filings, writes the report, checks the numbers against them and cites each source, 148 in this one. How we work · Corrections
Read Capgemini's full report freeNew accounts get one company's ready report free. No card.
Information only, not investment advice. The forecast gives three cases with their chances; it promises no price. Prices are those of the date shown.