Babcock International (BAB.L) stock forecast 2027–2029
What is the Babcock International (BAB.L) stock forecast?
Our forecast for Babcock International
1,463.03pby November 2027
1,613.66pby November 2029
From 1,068.00p at the November 10, 2026 close, that is a 38 % gain by 2027 and 53 % by 2029, dividends included.
It blends three cases for November 2027, pence per share:
- Bear81729% chance
- Base155451% chance
- Bull216920% chance
Our own forecast, built from Babcock International's filings. It is not an average of analysts' price targets, so it can differ from them.
New accounts get one company's ready report free. No card.
Executive summary + 8 chapters · 19,890 words · 173 sources
Babcock International (BAB.L) key numbers
P/E, price to profit, is how many years of expected profit the price equals. Dividend yield is a year of dividends as a share of the price.
- 16.3xP/E on the profit our report expects over the next 12 months
- 0.7 %dividend yield
- Nov 19, 2026next results, expected
Prices and ratios: our report, at the November 10, 2026 close.
Where could Babcock International's shares be by November 2029?
Our weighted forecast is 1,463.03p in November 2027, a 38% return, and 1,613.66p in November 2029, a 53% return; returns include dividends. Bear, base and bull probabilities are 29%, 51% and 20%.
What has to go right or wrong for Babcock International?
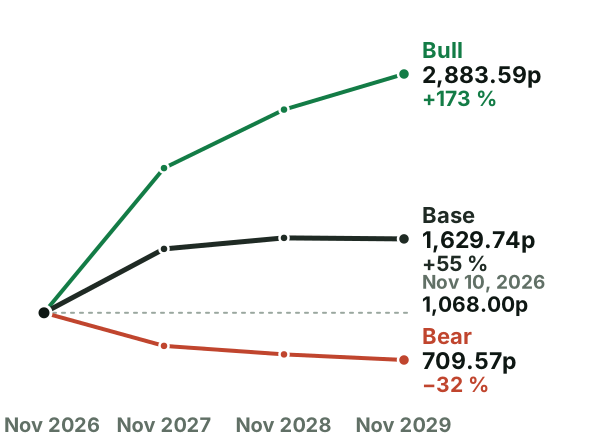
The bear case gives earnings of £259m, then £276m, then £283m. It assumes slower revenue growth, 4.7% to 5.0% net margins and further pressure from Type 31 or Gateway. The bull case gives £384m first, then £437m and £457m, because workable Gateway terms, profitable international submarine work and better Marine productivity lift margins. The bull still excludes the one-off Type 31 charge.
Bull case, 20% chance: if it goes right
2,883.59p by November 2029, +173 % with dividends.
Bear case, 29% chance: if it goes wrong
709.57p by November 2029, −32 % with dividends.
The next test: results expected November 19, 2026
Capex (net), Year to Mar 2027: 120–150, guided on 22 Jun 2026.
How much cash does Babcock International really make?
Cash from operations after tax and net interest was £402.4 million. Deducting capital spending and lease principal produced £208 million of free cash flow. Deducting stock pay as an economic cost produced £190 million of “real free cash flow”.
What does an investor pay for Babcock International's shares?
Our report makes no buy or sell call.
The last-twelve-month P/E looks demanding, while the forward P/E looks more moderate because FY26 included the Type 31 charge. The £140 million charge cut underlying EPS. It was 39.6p including the charge and 60.5p excluding it. The adjusted figure shows the rest of the business more clearly, but the cost of completing the frigates remains real.
EV to EBITDA compares the business with earnings before interest, tax, depreciation and amortisation. That helps compare companies with different financing, but EBITDA does not pay for equipment, pensions, interest or tax. Free cash flow does: Babcock reported underlying FY26 free cash flow of £261.8 million.
- Enterprise valuethe price of all its shares minus the cash it holds beyond its debts5.26p billion
- P/E, last 12 months25.9x
- Free cash flow yieldthe cash left in a year after paying for buildings and equipment, as a share of the company's value4.0%
- Real free cash flow yield3.7%
Questions about Babcock International (BAB.L) stock
Where will Babcock International stock be in 5 years?
Our report's forecast goes to November 2029. By then it puts the shares between 709.57p in the bear case and 2,883.59p in the bull case, and at 1,613.66p with the three cases weighted by their chances. It makes no forecast past November 2029.
When is Babcock International's next earnings date?
Results are expected on November 19, 2026. Babcock International earnings: the next date and the last eight quarters →
Does Babcock International pay a dividend?
Yes. At the November 10, 2026 close, a year of dividends came to 0.7 % of the share price (our report). Babcock International dividend →
Who are Babcock International's competitors?
Our report compares Babcock International with HII.
Why is this forecast different from analysts' price targets?
Analysts' price targets average the share prices that brokerage analysts expect. Our report builds its own three cases from Babcock International's filings, gives each a chance and counts dividends.
More on Babcock International (BAB.L)
More Babcock International pages
Babcock International's own filings
This page gives the forecast. The report gives the reasons.
The full report: an executive summary and 8 chapters, 19,890 words, 52 tables. Its first page opens here, no account needed.
How it is made: AI reads Babcock International's filings, writes the report, checks the numbers against them and cites each source, 173 in this one. How we work · Corrections
Read the full report freeNew accounts get one company's ready report free. No card.
Information only, not investment advice. The forecast gives three cases with their chances; it promises no price. Prices are those of the date shown.