M&S stock forecast 2027–2029
MyStockButler's October 2026 analysis: M&S's weighted forecast is 389.20p in October 2029, implying a 4% loss including dividends. It hinges on earnings recovery and stronger cash generation.
Where could M&S's shares be by October 2029?
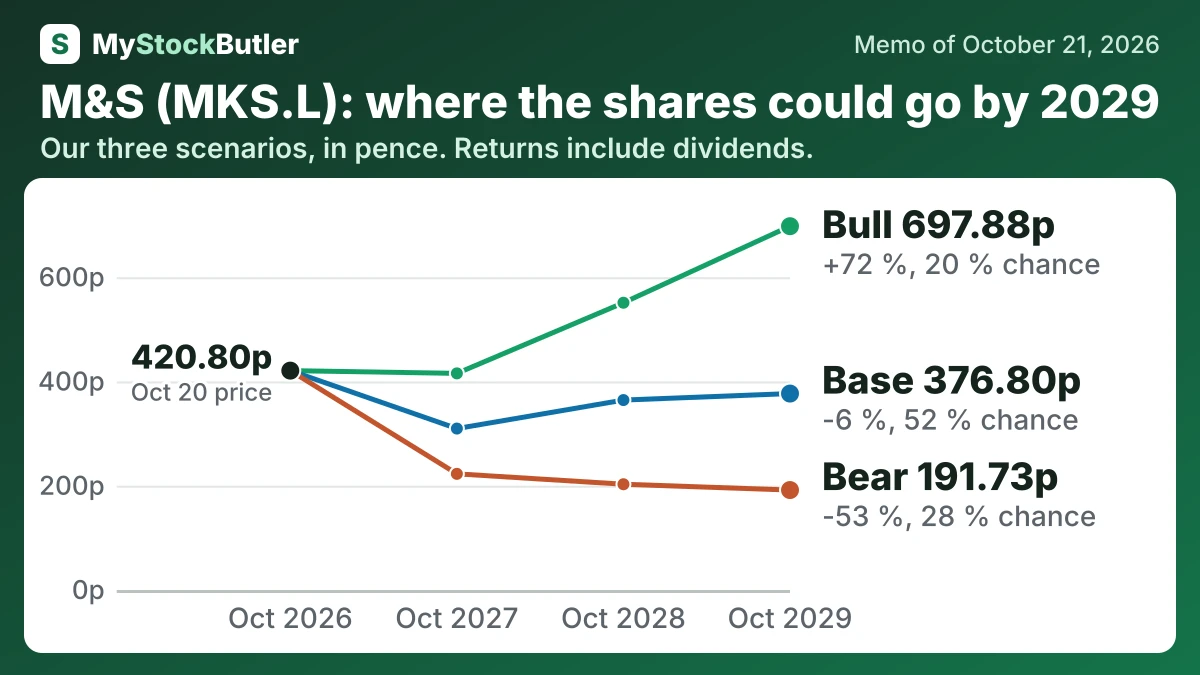
The share price could remain below 420.80p at both forecast horizons, hinging on earnings recovery and stronger cash generation. The weighted forecast reaches 306.52p in October 2027 and 389.20p in October 2029. It implies a 26% loss including dividends at the first date and a 4% loss at the last.
The bear case has a 28% probability. The base case has 52%; the bull case has 20%. By October 2029, the forecast spans 191.73p in the bear case to 697.88p in the bull case.
| Case | Probability | October 2027 | October 2028 | October 2029 |
|---|---|---|---|---|
| Bear | 28 % | 222.80 (-47 %) | 202.88 (-51 %) | 191.73 (-53 %) |
| Base | 52 % | 309.68 (-25 %) | 364.36 (-11 %) | 376.80 (-6 %) |
| Bull | 20 % | 415.54 (+0 %) | 551.06 (+34 %) | 697.88 (+72 %) |
| Weighted | 100 % | 306.52 (-26 %) | 356.49 (-13 %) | 389.20 (-4 %) |
What has to go right for M&S, and what could go wrong?
The case strengthens if Food reaches its FY28 margin goal, Fashion, Home & Beauty approaches its target and stronger cash generation funds investment. The November 4, 2026 half-year results should test profit growth against FY25 and fashion recovery without heavy markdowns. The November 10, 2026 Capital Markets Day should clarify warehouse commissioning, expected savings and cash needed before those savings arrive. M&S is a scale recovery story whose value depends on turning sales into durable per-share cash.
The bear case holds revenue to £18,000m, £18,400m and £19,000m, with margins of 2.6%, 2.6% and 2.7%, producing £468m, £478m and £513m. It reflects persistent markdowns and investment costs. The bull case reaches revenue of £18,200m, £19,200m and £20,300m, with margins of 3.4%, 4.0% and 4.5%, producing £619m, £768m and £914m. That requires faster full-price selling and profitable Food growth. Food’s margin fell to 4.6%, while online margin was negative 5.2%, so the cases properly remain wide.
How much cash does M&S really make?
M&S generates meaningful operating cash, but investment and fixed obligations leave much less available.
| Mar 2026 | Mar 2025 | Mar 2024 | Apr 2023 | Apr 2022 | |
|---|---|---|---|---|---|
| = Free cash flow | 91.4 | 487.9 | 513.7 | 259.8 | 752.6 |
| − Stock pay | 38.8 | 52.4 | 48.3 | 38.0 | 38.8 |
| = Real free cash flow | 52.6 | 435.5 | 465.4 | 221.8 | 713.8 |
| Free cash flow, % of revenue | 0.5% | 3.5% | 3.9% | 2.2% | 6.9% |
| Real free cash flow, % of revenue | 0.3% | 3.2% | 3.6% | 1.9% | 6.6% |
What this means. The company's own free cash flow is lower because it also subtracts spending on intangible assets, employee share transactions, acquisitions, and investments.
What does an investor pay for M&S today?
| Today (Oct 21, 2026) | |
|---|---|
| Share price | 420.80 |
| P/E, last 12 months (calculated) | 34.2x |
| P/E, next 12 months (calculated) | 11.6x |
| Free cash flow yield (calculated) | 1.0% |
| Real free cash flow yield (calculated) | 0.6% |
| Dividend yield (calculated) | 1.0% |