Accenture stock forecast 2027–2029
MyStockButler's October 2026 analysis: Accenture's weighted forecast reaches $235.08 in October 2029. Accenture's forecast hinges on AI and acquisitions creating profitable follow-on work without weakening pricing, utilization or cash generation.
Where could Accenture's shares be by 2029?
The forecast points to modest positive returns, but with a wide range of outcomes. The weighted price is $207.11 in October 2027, rising to $220.86 in October 2028. By October 2029 it reaches $235.08, a 23% total return including dividends.
The 2029 bear-to-bull range is $138.48 to $353.08. Today’s price is $208.36, close to the value implied by a 14.2x forward P/E and midpoint earnings. The bear receives 30% and the base case 50%. The bull receives 20%.
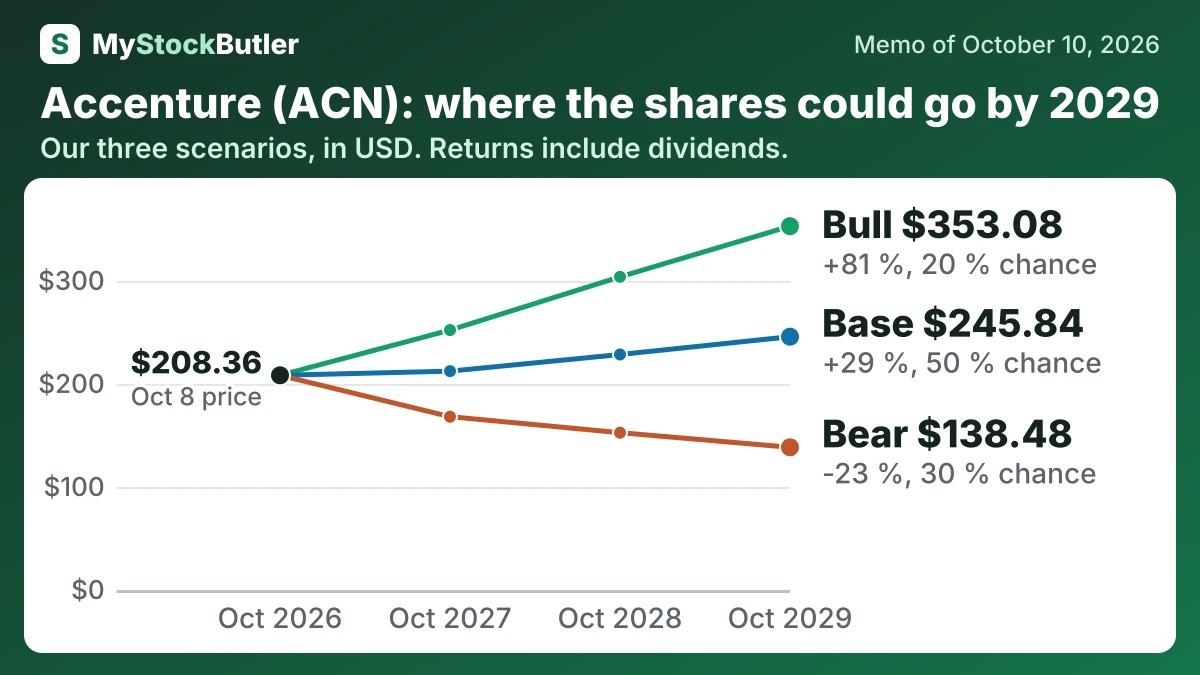
| Case | Probability | October 2027 | October 2028 | October 2029 |
|---|---|---|---|---|
| Bear | 30 % | 168.19 (-16 %) | 152.65 (-20 %) | 138.48 (-23 %) |
| Base | 50 % | 212.41 (+5 %) | 228.56 (+17 %) | 245.84 (+29 %) |
| Bull | 20 % | 252.24 (+24 %) | 303.93 (+53 %) | 353.08 (+81 %) |
| Weighted | 100 % | 207.11 (+3 %) | 220.86 (+13 %) | 235.08 (+23 %) |
What has to go right or wrong for Accenture?
The base case starts with revenue growth of 4.5% in FY2027 and 5.0% thereafter. The first figure sits within Accenture’s 3%–6% guidance. Acquisitions are expected to add 2.0%–2.5%, while moderate organic demand supports the later mid-single-digit path. The bear case falls to 1.0% at its weakest as cautious budgets, price pressure and fading acquisition comparisons constrain work. The bull case reaches 8.0% as AI projects enter production and acquired capabilities create follow-on services.
| FY2027 | FY2028 | FY2029 | FY2030 | |
|---|---|---|---|---|
| Revenue growth | 4.5 % (2.5 % / 6.0 %) | 5.0 % (1.0 % / 8.0 %) | 5.0 % (2.0 % / 8.0 %) | 5.0 % (2.0 % / 7.0 %) |
| Net margin | 11.4 % (10.8 % / 11.6 %) | 11.5 % (10.5 % / 12.0 %) | 11.6 % (10.2 % / 12.4 %) | 11.7 % (10.0 % / 12.7 %) |
| Earnings per share | 14.53 (13.48 / 15.07) | 15.64 (13.28 / 17.13) | 16.82 (13.18 / 19.39) | 18.08 (13.23 / 21.52) |
| Buybacks | 5,400 (5,400 / 5,800) | 5,500 (3,800 / 6,200) | 5,700 (3,500 / 6,500) | 5,900 (3,500 / 6,800) |
| Dividend per share | 6.84 (6.84 / 6.84) | 7.39 (7.04 / 7.59) | 7.98 (7.25 / 8.42) | 8.62 (7.47 / 9.35) |
How much cash does Accenture really make?
Cash from operations was $12.363 billion in FY2026. Capital spending was $742.748 million, leaving calculated free cash flow of $11.621 billion. A services firm needs little factory equipment, but salaries, training and development already pass through operating costs, so low capital spending does not make the whole business cheap to run.
Stock compensation was $2.1 billion. It is recorded as an expense but added back to operating cash because granting shares does not immediately use cash. Economically, however, the payment still transfers value from existing owners through dilution or through cash repurchases. Deducting it leaves a stricter free-cash-flow measure of $9.52 billion.
| Year to Aug 2026 | Year to Aug 2025 | Year to Aug 2024 | Year to Aug 2023 | Year to Aug 2022 | |
|---|---|---|---|---|---|
| Cash from operations | 12,363,346 | 11,474,399 | 9,131,027 | 9,524,268 | 9,541,129 |
| Capital spending | 742,748 | 600,039 | 516,509 | 528,172 | 717,998 |
| Free cash flow (calculated) | 11,620,598 | 10,874,360 | 8,614,518 | 8,996,096 | 8,823,131 |
| Stock-based pay | 2,100,433 | 2,093,878 | 1,941,590 | 1,913,051 | 1,679,789 |
| Real free cash flow (after stock pay) (calculated) | 9,520,165 | 8,780,482 | 6,672,928 | 7,083,045 | 7,143,342 |
| Real free cash flow per share (calculated) | 15.42 | 13.88 | 10.49 | 11.09 | 11.11 |