Cognizant stock forecast 2027–2029
MyStockButler's October 2026 analysis: Cognizant’s probability-weighted forecast reaches $76.47 in October 2027 and $94.92 in October 2029, with bear, base and bull probabilities of 25%, 55% and 20%, respectively. The outcome turns on bookings becoming staffed work, recognized revenue, profit and collected cash.
Where could Cognizant’s shares be by October 2029?
The probability-weighted forecast reaches $76.47 in October 2027, a 14% total return including dividends, and $94.92 in October 2029, a 46% total return including dividends. Bear, base and bull probabilities are 25%, 55% and 20%, respectively.
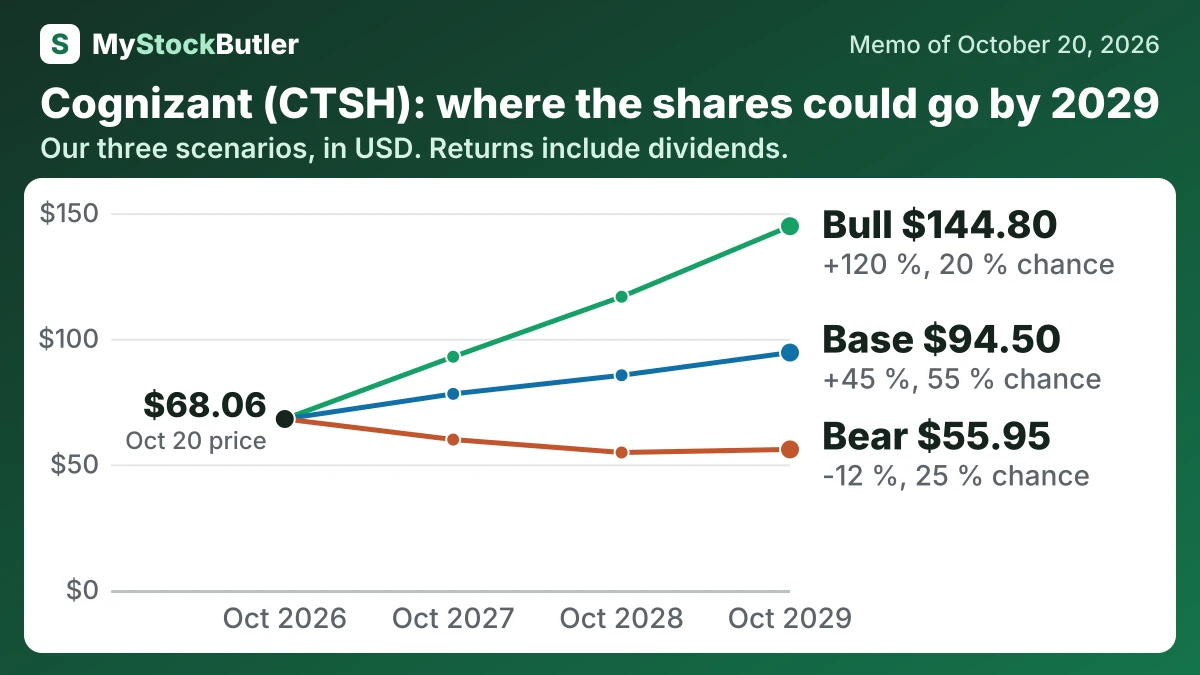
| Case | Probability | October 2027 | October 2028 | October 2029 |
|---|---|---|---|---|
| Bear | 25 % | 59.87 (-10 %) | 54.73 (-16 %) | 55.95 (-12 %) |
| Base | 55 % | 78.07 (+17 %) | 85.47 (+30 %) | 94.50 (+45 %) |
| Bull | 20 % | 92.84 (+38 %) | 116.72 (+76 %) | 144.80 (+120 %) |
| Weighted | 100 % | 76.47 (+14 %) | 84.03 (+28 %) | 94.92 (+46 %) |
What has to go right or wrong for Cognizant?
The bear case gives $2,600 million first and then $2,580 million in each later period. Revenue growth slows and normalized margins decline because AI displacement, weak collections and slow contract conversion offset productivity. The bull case rises from $3,030 million to $3,350 million and then $3,700 million because bookings convert into work, paid AI deployments become repeatable and productivity gains reach margins.
How much cash does Cognizant really make?
Free cash flow is operating cash less capital spending. Capital spending was $288 million in 2025. Conventional free cash flow was therefore $2,595 million, or 12.3% of revenue. The measure is useful, but it excludes acquisition spending and treats training, selling and much technology development as operating costs.
| 2025 | 2024 | 2023 | 2022 | 2021 | |
|---|---|---|---|---|---|
| Cash from operations | 2,883 | 2,124 | 2,330 | 2,568 | 2,495 |
| Of which, tied up in working capital | 338 | 510 | 189 | 324 | 488 |
| − Capital spending | 288 | 297 | 317 | 332 | 279 |
| = Free cash flow | 2,595 | 1,827 | 2,013 | 2,236 | 2,216 |
| − Stock pay | 181 | 175 | 176 | 261 | 246 |
| = Real free cash flow | 2,414 | 1,652 | 1,837 | 1,975 | 1,970 |
What does an investor pay for Cognizant today?
The P/E ratio compares the share price with profit per share. Its trailing version uses reported earnings, while its forward version uses an estimate. The forward multiple is lower partly because a $390 million noncash tax expense reduced reported earnings in 2025 after a change in United States tax law. That makes the forecast look cheaper, but the forecast still has to arrive.
| Today (Oct 20, 2026) | |
|---|---|
| Share price | 68.06 |
| Market value (calculated) | 30,657.23 |
| Enterprise value (calculated) | 31,166.23 |
| P/E, last 12 months (calculated) | 14.6x |
| P/E, next 12 months (calculated) | 11.8x |
| Real free cash flow yield (calculated) | 7.9% |
What this means. Enterprise value is higher than market value because it includes the company's debt after subtracting its cash, showing the cost of buying the whole business.