J&T (1519.HK) stock forecast 2027–2029
What is the J&T (1519.HK) stock forecast?
Our forecast for J&T
HK$8.46by November 2027
HK$10.34by November 2029
From HK$9.71 at the November 6, 2026 close, that is a 13 % loss by 2027 and a 6 % gain by 2029, dividends included.
It blends three cases for November 2027, HK$ per share:
- Bear2.1428 % chance
- Base8.3954 % chance
- Bull18.4918 % chance
Our own forecast, built from J&T's filings. It is not an average of analysts' price targets, so it can differ from them.
New accounts get one company's ready report free. No card.
Executive summary + 8 chapters · 19,830 words · 106 sources
Where could J&T's shares be by 2029?
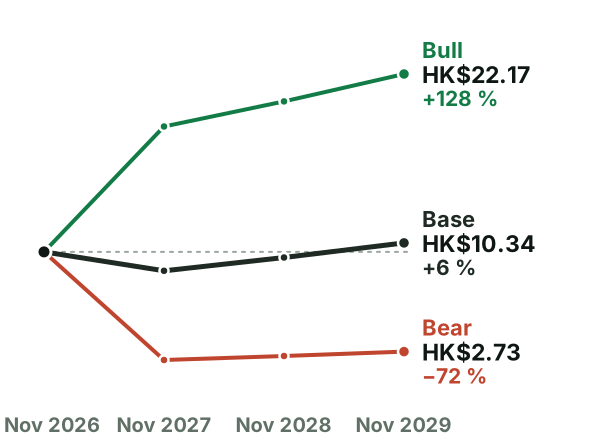
The forecast points to modest downside over one and two years, followed by a small gain over three years. The probability-weighted price is HK$8.46 in November 2027, HK$9.35 in November 2028 and HK$10.34 in November 2029. Including dividends, those outcomes represent returns of negative 13%, negative 4% and positive 6% from today’s HK$9.71.
The range is much wider than the weighted result suggests. By November 2029, the bear case reaches HK$2.73, while the bull case reaches HK$22.17. The assigned probabilities are 28% bear, 54% base and 18% bull.
What has to go right or wrong for J&T?
The bear case gives $22 billion of revenue and a 3.4% margin, producing $748 million of EBIT. Falling revenue per parcel, customer concentration and heavy capacity spending explain the restraint. The bull case reaches $36 billion of revenue at a 6.25% margin, or $2,250 million of EBIT, requiring sustained parcel growth, better density and stronger New Markets economics.
The forecast's table · base case, then bear / bull in brackets; USD millions, per share in USD, unless shown · FY2030
- Operating profit (EBIT)1,508 (748 / 2,250)
- Shares (millions)9,367 (9,568 / 9,464)
- Exit multiple (enterprise value to operating profit (ebit))9.00 (7.00 / 12.00)
- Net debt-355 (1,402 / -2,705)
Bull case, 18 % chance: if it goes right
HK$22.17 by November 2029, +128 % with dividends.
Bear case, 28 % chance: if it goes wrong
HK$2.73 by November 2029, −72 % with dividends.
How much cash does J&T really make?
Stock compensation makes the owner’s calculation stricter again. It is not a cash payment today, but it gives employees equity and can dilute existing owners. Treating the US$112.83 million charge as an economic cost leaves almost nothing in 2025 “real free cash flow.” That is an analytical measure, not a cash-flow-statement line.
What does an investor pay for J&T?
P/E measures the price paid for each unit of profit. Its forward version is lower when investors expect earnings to rise, but the comparison matters only if the earnings measures are consistent. J&T’s adjusted profit removes items such as share-based payments, so it should not be treated as identical to the earnings used in every P/E calculation.
J&T earnings: how did the last quarter go?
Questions about J&T (1519.HK) stock
Where will J&T stock be in 5 years?
Our report's forecast goes to November 2029. By then it puts the shares between HK$2.73 in the bear case and HK$22.17 in the bull case, and at HK$10.34 with the three cases weighted by their chances. It makes no forecast past November 2029.
Who are J&T's competitors?
Our report compares J&T with ZTO.
Why is this forecast different from analysts' price targets?
Analysts' price targets average the share prices that brokerage analysts expect. Our report builds its own three cases from J&T's filings, gives each a chance and counts dividends.
More on J&T (1519.HK)
More J&T pages
J&T's own filings
This page gives the forecast. The report gives the reasons.
The full report: an executive summary and 8 chapters, 19,830 words, 52 tables. Its first page opens here, no account needed.
How it is made: AI reads J&T's filings, writes the report, checks the numbers against them and cites each source, 106 in this one. How we work · Corrections
Read J&T's full report freeNew accounts get one company's ready report free. No card.
Information only, not investment advice. The forecast gives three cases with their chances; it promises no price. Prices are those of the date shown.