ZTO stock forecast 2027–2029
MyStockButler's October 2026 analysis: In October 2027, the weighted price is HKD166.71. It hinges on parcel contribution, partner health and cash left after network investment.
Where could ZTO's shares be by 2029?
In October 2027, the weighted price is HKD166.71. The total return is 8%. By October 2029, the weighted price reaches HKD223.43. The total return is 48%. The bear case has 28% probability. The base case has 52%. The bull case has 20%.
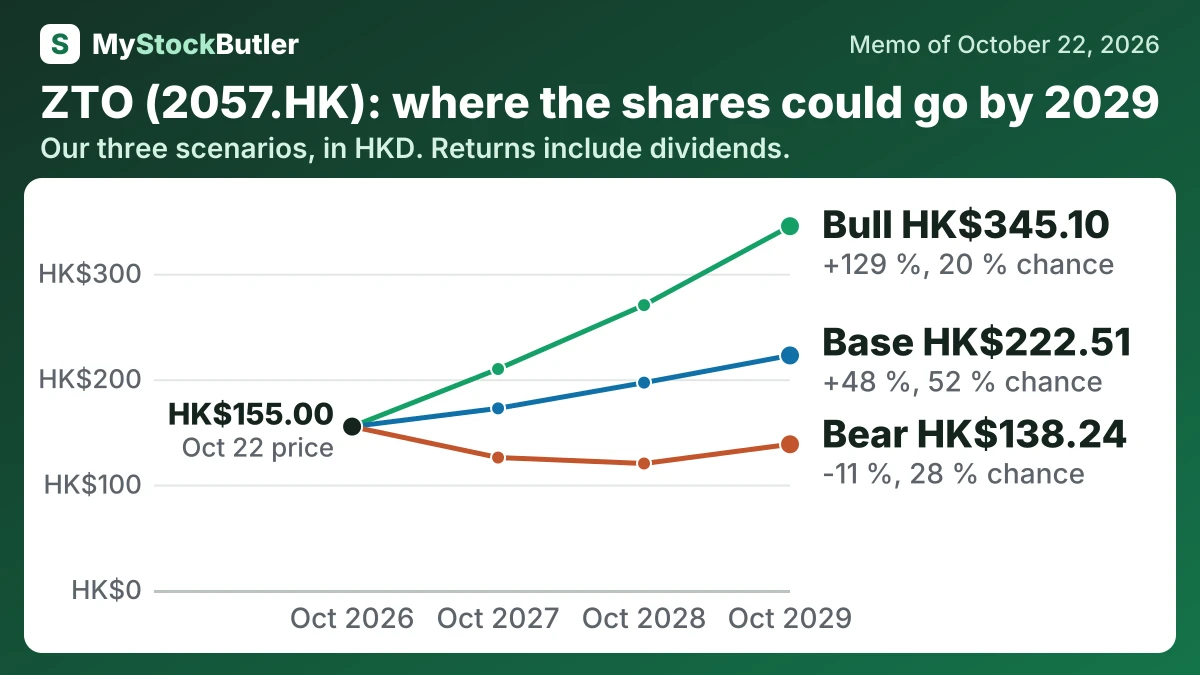
| Case | Probability | October 2027 | October 2028 | October 2029 |
|---|---|---|---|---|
| Bear | 28 % | 125.64 (-19 %) | 119.99 (-23 %) | 138.24 (-11 %) |
| Base | 52 % | 172.32 (+11 %) | 196.70 (+29 %) | 222.51 (+48 %) |
| Bull | 20 % | 209.63 (+37 %) | 270.24 (+79 %) | 345.10 (+129 %) |
| Weighted | 100 % | 166.71 (+8 %) | 189.93 (+25 %) | 223.43 (+48 %) |
What has to go right for ZTO, and what could go wrong?
The bear case requires renewed parcel-price competition, a less profitable direct-account and returns mix, underused capacity and stressed outlets. EBITDA falls, buybacks slow and investors cut the multiple. It produces HKD125.64 in October 2027 and HKD138.24 in October 2029, an 11% total loss. Its 28% probability reflects the 8.0% EBITDA fall in 2025 and higher key-account costs, partly offset by recent EBITDA growth and lower transport costs.
The bull case requires pricing discipline, profitable higher-value parcels, fuller routes, better cash conversion and large repurchases. It produces HKD209.63 initially and HKD345.10 by 2029, a 129% return. The probability is 20% because Q2 evidence supports upside, but mix-driven pricing, partner costs and the required margin expansion make this outcome demanding.
How much cash does ZTO really make?
ZTO generated RMB11,968.419 million from operations in 2025. Net income was RMB9,080.651 million. After equipment spending of RMB5,214.279 million, free cash flow was RMB6,754.140 million. After stock compensation of RMB229.250 million, the stock-pay-adjusted surplus was RMB6,524.890 million.
| 2025 | 2024 | 2023 | 2022 | 2021 | |
|---|---|---|---|---|---|
| Cash from operations | 11,968.419 | 11,429.436 | 13,360.967 | 11,479.308 | 7,220.217 |
| − Capital spending | 5,214.279 | 5,208.156 | 6,528.833 | 7,067.744 | 8,360.497 |
| = Free cash flow | 6,754.14 | 6,221.28 | 6,832.134 | 4,411.564 | -1,140.28 |
| − Stock pay | 229.25 | 318.692 | 254.976 | 178.98 | 248.027 |
| = Real free cash flow | 6,524.89 | 5,902.588 | 6,577.158 | 4,232.584 | -1,388.307 |
| Real free cash flow, % of revenue | 13.3% | 13.3% | 17.1% | 12.0% | -4.6% |
What this means. The cash figures include money from lending through network partners, so they are not just cash from selling the company's products.
What does an investor pay for ZTO today?
The price-to-earnings ratio, or P/E, tells how much investors pay for each unit of profit. A trailing P/E uses the past year’s earnings, while a forward P/E uses an estimate for the next year. The small gap between ZTO’s two P/E measures implies about 5% earnings growth if the share price stays unchanged. That is an arithmetic expectation, not a promise.
| Today (Oct 22, 2026) | |
|---|---|
| Share price | 155.00 |
| P/E, last 12 months (calculated) | 10.2x |
| P/E, next 12 months (calculated) | 9.7x |
| Free cash flow yield (calculated) | 6.8% |
| Real free cash flow yield (calculated) | 6.6% |
What this means. Several figures include the company's lending business, so they reflect money lent to customers as well as its main operations.