Vivmark earnings
MyStockButler's October 2026 analysis: Vivmark's next results are expected on November 4, 2026. The key thing to watch is whether merger savings become cash benefits before construction and legal obligations arrive.
What has Vivmark guided for 2026?
On September 15, 2026, management restored a narrower promise: same-store residential revenue growth of 1.5%–2.5% for 2026. The midpoint is 2.0%. “Same-store” means comparing the same communities in both periods, so new buildings cannot disguise weak performance in existing ones. If a landlord owns 100 apartments and adds 20, total rent can rise simply because it owns more homes; same-store analysis asks whether the original 100 produced more.
| Period guided | Low | High | Date given | |
|---|---|---|---|---|
| Total Same Store Residential Revenue | Year to Dec 2026 | 1.5% | 2.5% | Sep 15, 2026 |
| Same Store Revenue Growth Outlook — Higher Performing Markets | Year to Dec 2026 | 3.0% | 7.0% | Sep 15, 2026 |
| Same Store Revenue Growth Outlook — Intermediate Performing Markets | Year to Dec 2026 | 1.0% | 2.0% | Sep 15, 2026 |
| Same Store Revenue Growth Outlook — Lower Performing Markets | Year to Dec 2026 | 1.0% | Sep 15, 2026 | |
| Combined common dividends (US$ millions) | Year to Dec 2026 | 2,000 | Sep 15, 2026 | |
| Annual leverage neutral self-funding capacity (US$ millions) | Annual capacity | 2,000 | Sep 15, 2026 |
What this means. These are the company’s forecasts and merger targets, not money it has already earned, and “below 1.0%” and “less than 750 million dollars” exclude the stated upper number.
Did Vivmark keep its past promises?
The legacy promise-keeping record is mixed, earning 3/5. Recurring apartment measures were more dependable than EPS, which was more exposed to changing sale gains and unusual events. Past revisions reflected weather damage, weaker demand, delinquency and delayed income initiatives. The combined company must now establish its own record.
| What management forecast | Checked | Above | Within | Below |
|---|---|---|---|---|
| Normalized FFO per share | 5 years | 2 | 3 | 0 |
| Revenue change — Same Store (includes Residential and Non-Residential) | 5 years | 2 | 3 | 0 |
| Expense change — Same Store (includes Residential and Non-Residential) | 5 years | 1 | 3 | 1 |
| NOI change / Net Operating Income (NOI) change — Same Store (includes Residential and Non-Residential) | 5 years | 3 | 2 | 0 |
| EPS | 5 years | 2 | 0 | 3 |
What is Vivmark's results trend?
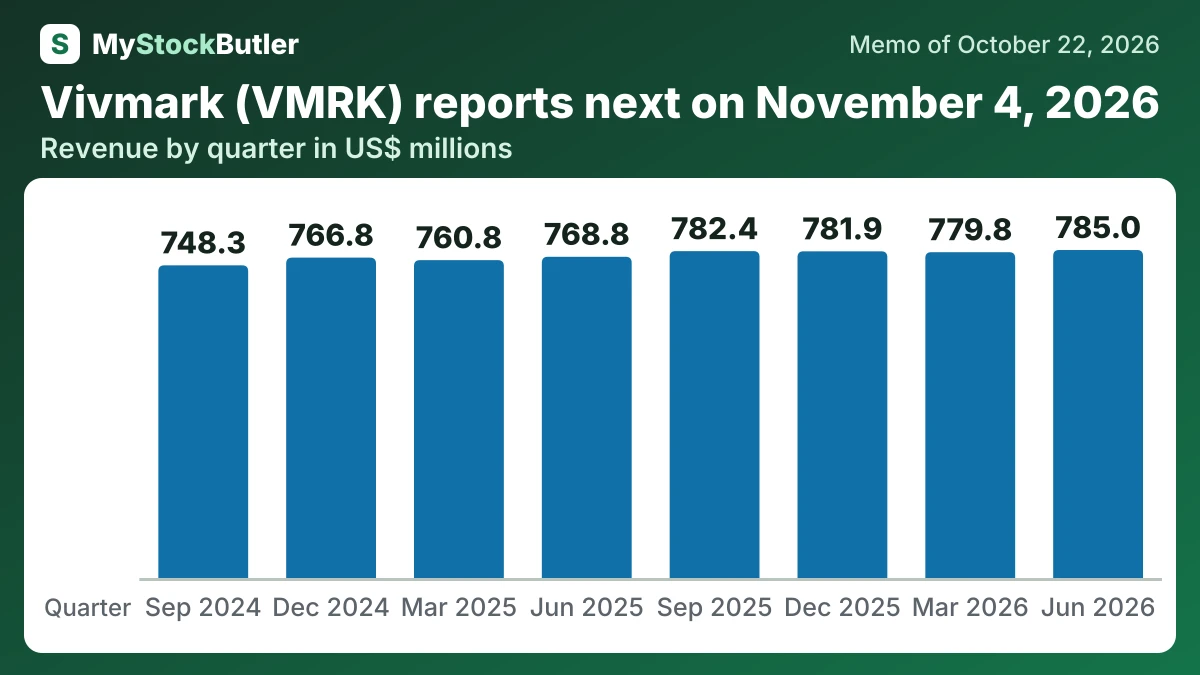
Q2 2026 brought revenue growth, but not growth in total property income.
| Jun 2026 | Mar 2026 | Dec 2025 | Sep 2025 | Jun 2025 | Mar 2025 | Dec 2024 | Sep 2024 | |
|---|---|---|---|---|---|---|---|---|
| Revenue | 785,049 | 779,846 | 781,911 | 782,411 | 768,827 | 760,810 | 766,779 | 748,348 |
| Net operating income | 520,038 | 513,164 | 527,538 | 525,957 | 520,221 | 505,085 | 521,754 | 507,173 |
| FFO per share | 1.00 | 0.89 | 0.97 | 1.05 | 0.98 | 0.94 | 0.97 | 0.99 |
| Normalized FFO per share | 1.02 | 0.99 | 1.03 | 1.02 | 0.99 | 0.95 | 1.00 | 0.98 |
| Dividend per share | 0.70 | 0.70 | 0.69 | 0.69 | 0.69 | 0.69 | 0.68 | 0.68 |
What this means. The occupancy figures are three-month averages for the same properties, not the percentage of all properties occupied at the end of each quarter.
What should I watch in Vivmark's next results?
The next results must show whether merger savings become cash benefits before construction and legal obligations arrive. Vivmark plans to release third-quarter results on November 4, 2026, followed by a call on November 5. Investors should look for a combined earnings baseline, remaining development commitments and a clear bridge from apartment operations to integration costs.