Vivmark dividend: payout and coverage
MyStockButler's October 2026 analysis: Vivmark pays US$2.77 per share in 2025, and its dividend is covered by its adjusted earnings measure. Vivmark's cash from operations also covered dividends in 2025, though development and capital spending left only a thin cushion.
How much does Vivmark pay per share?
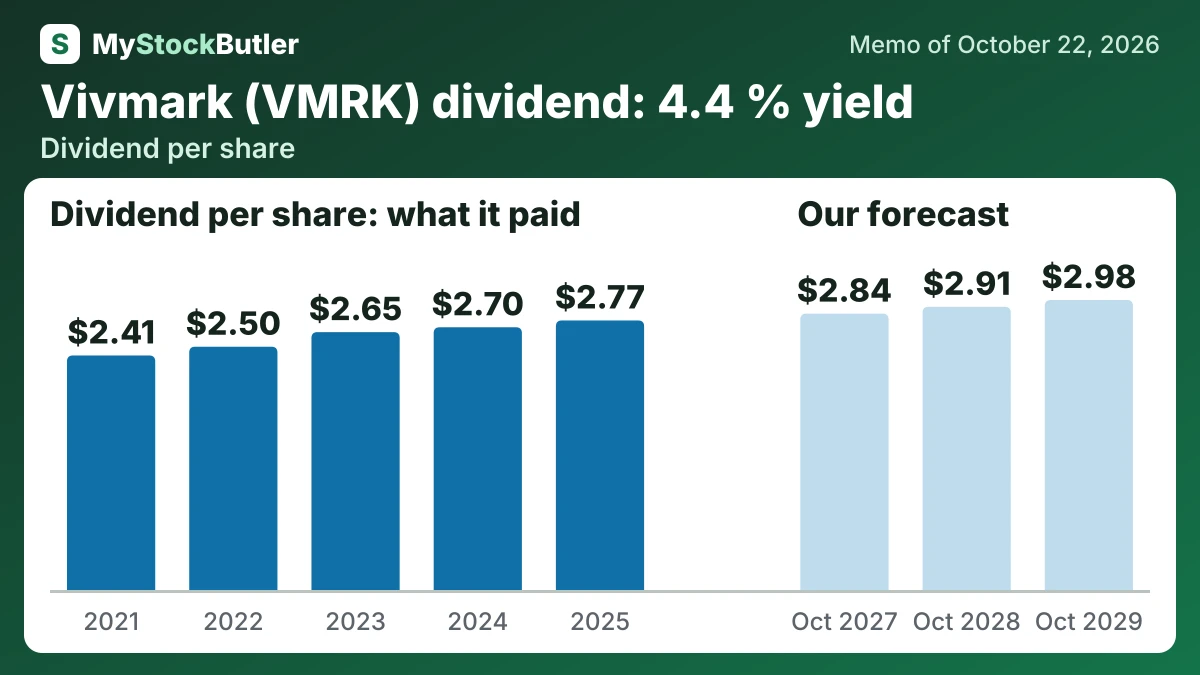
On that earnings basis, the dividend was US$2.77 per share and the payout ratio was 69.4%. The ratio improved from 80.6% in 2021. But the numerator and denominator must match: shareholder dividends and earnings available to common shareholders and operating-partnership units do not have identical ownership bases.
The dividend base case rises from the current $2.81 annual rate to $2.84 in the first year. It reaches $2.91 and then $2.98. That is slower than the predecessor's record of annual increases, because construction, integration, and financing needs compete for cash. The 69.4% legacy AFFO payout ratio leaves room for increases, but projected common dividends and major construction commitments limit the pace.
| 2025 | 2024 | 2023 | 2022 | 2021 | |
|---|---|---|---|---|---|
| Normalized FFO per share | 3.99 | 3.89 | 3.78 | 3.52 | 2.99 |
| Dividend per share | 2.77 | 2.70 | 2.65 | 2.50 | 2.41 |
| AFFO payout ratio | 69.4% | 69.4% | 70.1% | 71.0% | 80.6% |
What this means. The payout ratio is labeled adjusted funds from operations, but it uses the company's normalized funds from operations, which does not subtract recurring property spending.
Is Vivmark's dividend covered by its cash?
In 2025, cash from operations was $1.649 billion and dividends paid were $1.046 billion. That left $603 million, while development and capital spending used $552 million. Across 2021–25, operating cash after dividends totalled $2.582 billion, against $2.385 billion of development and capital spending.
| 2025 | 2024 | 2023 | 2022 | 2021 | |
|---|---|---|---|---|---|
| Cash from operations | 1,648,763 | 1,573,607 | 1,532,798 | 1,454,756 | 1,260,184 |
| − Dividends paid | 1,046,247 | 1,019,050 | 990,148 | 931,783 | 900,468 |
| = Operating cash after dividends | 602,516 | 554,557 | 542,650 | 522,973 | 359,716 |
| − Acquisitions | 829,880 | 1,626,386 | 327,297 | 162,901 | 1,760,665 |
| + Properties sold | 1,107,259 | 960,398 | 374,018 | 720,302 | 1,707,747 |
| − Development and capital spending | 552,073 | 524,180 | 457,066 | 447,382 | 404,629 |
What could change Vivmark's dividend?
The key base-case checkpoint is year-end 2027, when management expects 85% of targeted synergies. The full $125 million run rate is expected within 18 months of closing. Development openings and lease-up results through 2028–2029 would then determine whether AFFO growth and a higher multiple deserve the bull case.
| October 2027 | October 2028 | October 2029 | |
|---|---|---|---|
| AFFO (company's measure) | 3,320 (3,050 / 3,430) | 3,450 (3,100 / 3,700) | 3,570 (3,150 / 3,980) |
| Shares (millions) | 776 (776 / 774) | 776 (777 / 774) | 777 (778 / 773) |
| Dividends per share | 2.84 (2.81 / 2.92) | 2.91 (2.67 / 3.04) | 2.98 (2.67 / 3.16) |
| Price to AFFO (company's measure) | 16.00 (14.00 / 17.00) | 16.25 (13.50 / 18.00) | 16.50 (13.00 / 19.00) |
What is Vivmark's dividend yield today?
At US$63.575, the shares trade at 16.26 times FFO per share and yield 4.4%. The dividend reached US$2.77 per share in 2025, equal to 69.4% of Normalized FFO per share of US$3.99.