Essex stock forecast 2027–2029
MyStockButler's October 2026 analysis: Essex's weighted scenario is $300.72 in October 2029, with a 22% return including dividends. It hinges on West Coast rent growth becoming durable per-share earnings after expenses and debt.
Where could Essex's shares be by October 2029?
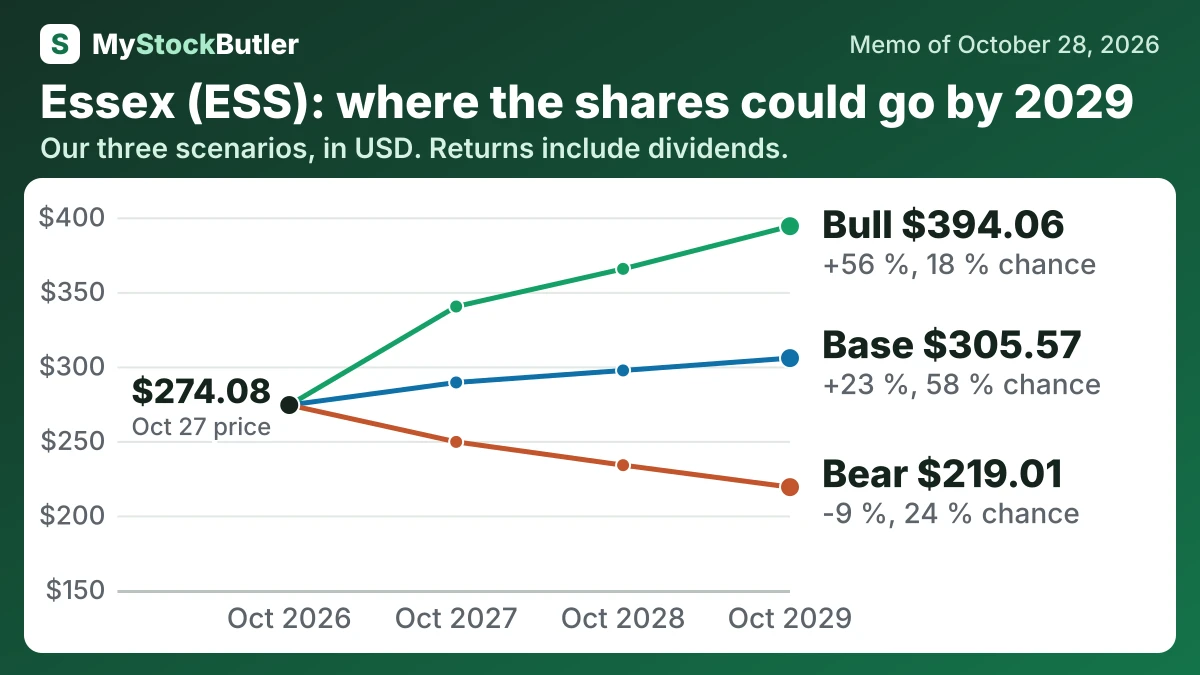
The weighted price is $288.83 in October 2027, a 9% return including dividends. It reaches $300.72 in October 2029, a 22% return. The bear case carries a 24% probability; the base case, 58%. The bull case carries 18%, with October 2029 outcomes ranging from $219.01 to $394.06.
| Case | Probability | October 2027 | October 2028 | October 2029 |
|---|---|---|---|---|
| Bear | 24 % | 249.35 (-5 %) | 233.74 (-7 %) | 219.01 (-9 %) |
| Base | 58 % | 289.23 (+9 %) | 297.29 (+16 %) | 305.57 (+23 %) |
| Bull | 18 % | 340.17 (+28 %) | 365.44 (+41 %) | 394.06 (+56 %) |
| Weighted | 100 % | 288.83 (+9 %) | 294.30 (+15 %) | 300.72 (+22 %) |
What has to go right or wrong for Essex?
The bear case holds starting earnings at $1,076 million, then allows only 1% and 1.5% growth. Seattle’s NOI fell 0.4% as expenses rose 5.3%, while Essex remains exposed to West Coast hiring and affordability pressure. The bull case reaches $1,119 million, $1,169 million and $1,227 million through faster leasing, controlled expenses and broader regional recovery. South Linden supports the story, but its expected 6% stabilized yield is too distant to drive near-term earnings.
The forecast would move toward the bear case if same-property revenue and occupancy weaken in Southern California or Seattle between October 2027 and October 2028. Persistent expense growth through October 2029 would further reduce NOI and margins. Higher refinancing costs or risk aversion in October 2028–2029 would compress the multiple.
How much cash does Essex really make?
In 2025, operating cash flow was $1.074 billion. Rental-property capital expenditures were $140.3 million, leaving about $934.1 million by that narrow calculation. Essex also spent on redevelopment and development additions, so this is not a complete measure of cash available to shareholders.
Essex paid a $10.28 dividend per share in 2025, producing a 64.5% payout ratio. That leaves a margin against the stated earnings measure, but the margin must also absorb upkeep, debt principal and future investment.
| 2025 | 2024 | 2023 | 2022 | 2021 | |
|---|---|---|---|---|---|
| Core FFO (company's measure) | 1,062,740 | 1,038,167 | 999,907 | 977,857 | 841,310 |
| Core FFO per share (company's measure) | 15.94 | 15.60 | 15.03 | 14.51 | 12.49 |
| Dividends paid | 654,068 | 620,466 | 586,976 | 565,924 | 542,860 |
| Core FFO payout ratio | 64.5% | 62.8% | 61.5% | 60.6% | 66.9% |
What this means. The payout ratio shows how much of the company's core funds from operations it pays as dividends, not how much of its accounting profit it pays.
What does an Essex share cost today?
| Today (Oct 28, 2026) | |
|---|---|
| Share price | 274.08 |
| Market value (calculated) | 17,633,759.04 |
| Price to FFO (calculated) | 17.8x |
| Price to Core FFO (calculated) | 17.0x |
| Dividend yield (calculated) | 3.8% |
| Latest common shares outstanding (millions) | 64.338 |
What this means. The calculated market value counts only common shares and leaves out operating partnership and DownREIT units, so it may be lower than the company's total economic value.