Vivmark stock forecast 2027–2029
MyStockButler's October 2026 analysis: The weighted forecast puts the shares at US$66.48 by October 2027 and US$74.39 by October 2029. The investment turns on whether rent growth survives concessions and becomes cash generation per share after integration and development demands.
Where could Vivmark’s shares be by October 2029?
The weighted forecast puts the shares at US$66.48 by October 2027 and US$74.39 by October 2029, if same-store growth and merger savings become recurring per-share earnings. Those prices imply a 9% total return and a 31% total return including dividends, respectively.
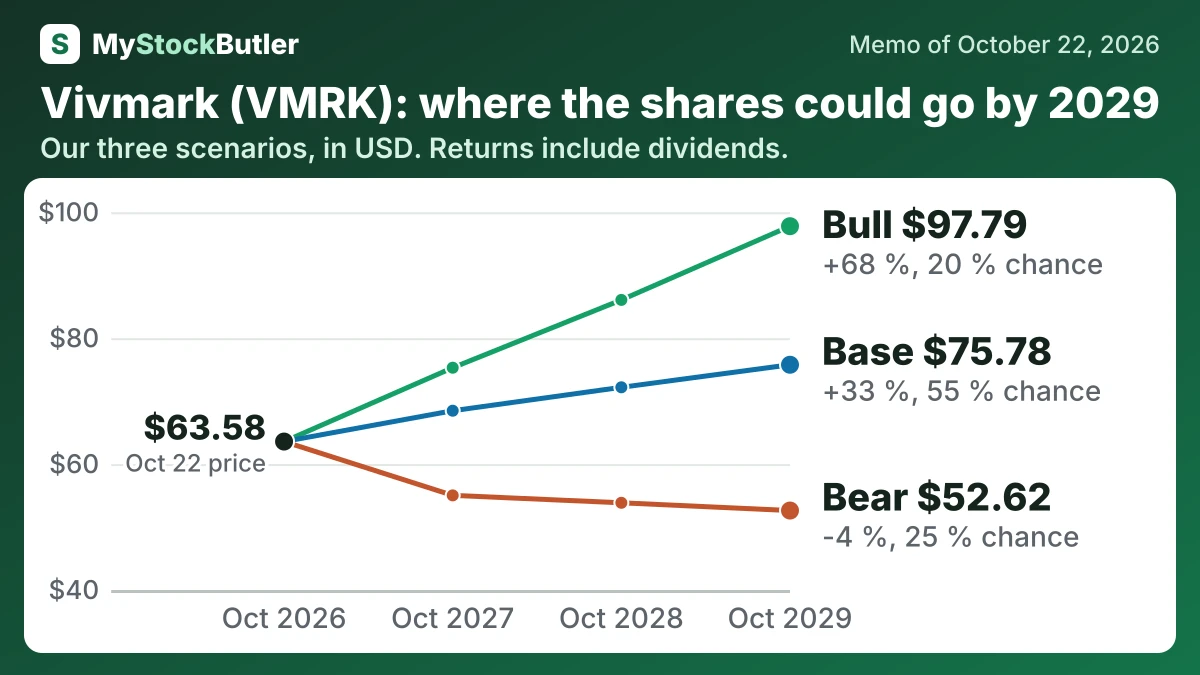
| Case | Probability | October 2027 | October 2028 | October 2029 |
|---|---|---|---|---|
| Bear | 25 % | 55.03 (-9 %) | 53.85 (-7 %) | 52.62 (-4 %) |
| Base | 55 % | 68.48 (+12 %) | 72.20 (+23 %) | 75.78 (+33 %) |
| Bull | 20 % | 75.31 (+23 %) | 86.08 (+45 %) | 97.79 (+68 %) |
| Weighted | 100 % | 66.48 (+9 %) | 70.39 (+20 %) | 74.39 (+31 %) |
What has to go right or wrong for Vivmark?
Management guides to annual 2026 same-store residential revenue growth of 1.5%–2.5%, with a 2.0% midpoint. It targets US$125 million of annual net operating synergies within 18 months of closing, with 85% expected by year-end 2027. The US$750 million upper estimate for transaction costs and the US$4.4 billion construction pipeline are material demands on the cash the merger must generate.
The forecast assigns 25% to the bear case, 55% to the base case and 20% to the bull case. New-lease pricing, concessions and occupancy are decisive: September occupancy was 95.7% and asking rents rose 3.6%, but asking rents do not confirm signed-lease economics. November 4, 2026 results and the November 5 call should establish the combined earnings baseline. Year-end 2027 is the synergy checkpoint. Development openings and lease-up through 2028–2029 will test returns.
| 2025 | 2024 | 2023 | 2022 | 2021 | |
|---|---|---|---|---|---|
| Net operating income | 2,078,801 | 2,018,282 | 1,947,275 | 1,862,903 | 1,613,360 |
| Same-store NOI growth | 2.2% | 3.1% | 6.2% | 14.1% | -6.5% |
| Occupancy | 95.6% | 96.0% | 95.4% | 95.6% | 95.7% |
| Net debt to EBITDAre | 4.27x | 4.38x | 4.12x | 4.38x | 5.61x |
What this means. The historical numbers describe Equity Residential alone, so they do not yet represent the combined company after the AvalonBay merger.
How much cash does Vivmark really make?
The figures labelled AFFO in this memo are Equity Residential's Normalized FFO measure. They do not deduct all recurring spending on roofs, appliances and building systems. In 2025, that measure was US$1,558,403 thousand, or US$3.99 per share.
Cash flow offers a second view. Operating cash inflow was US$1,648,763 thousand in 2025. After US$342,040 thousand of real-estate capital expenditure, US$1,306,723 thousand remained before development and other investing needs. That exceeded common dividends paid, but it was not all discretionary cash because other capital uses also competed for it.
| 2025 | 2024 | 2023 | 2022 | 2021 | |
|---|---|---|---|---|---|
| Normalized FFO | 1,558,403 | 1,521,606 | 1,477,081 | 1,371,828 | 1,161,364 |
| Normalized FFO per share | 3.99 | 3.89 | 3.78 | 3.52 | 2.99 |
| Dividends paid | 1,046,247 | 1,019,050 | 990,148 | 931,783 | 900,468 |
| AFFO payout ratio | 69.4% | 69.4% | 70.1% | 71.0% | 80.6% |
What this means. The payout ratio is our calculation, not the trust’s reported figure, and it uses declared regular dividends divided by normalized funds from operations per share even though the table calls it adjusted funds from operations.