MAA stock forecast 2027–2029
MyStockButler's November 2026 analysis: MAA's weighted price is $120.74 in November 2027, an 8% return including dividends. It hinges on supply absorption and new-lease pricing in 2027.
Where could MAA's shares be by 2029?
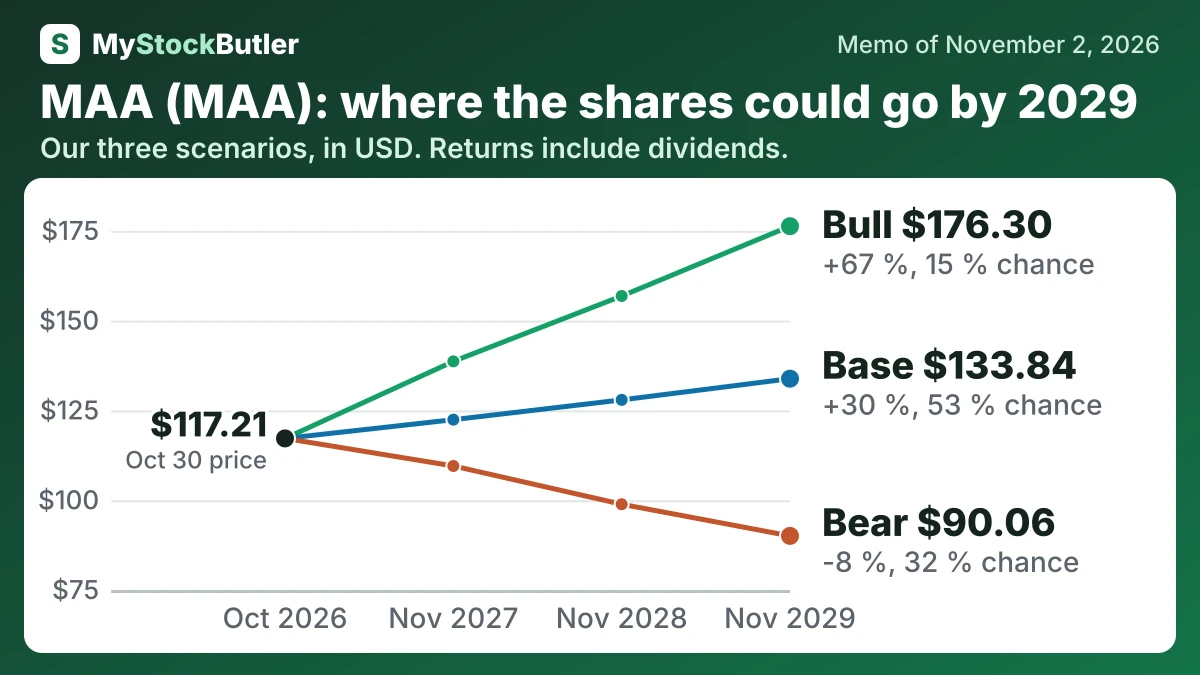
Our weighted price is $120.74 in November 2027, an 8% return including dividends. It reaches $126.20 in November 2029, a 23% return including dividends. The bear case has a 32% probability. The base case has 53%. The bull case has 15%.
| Case | Probability | November 2027 | November 2028 | November 2029 |
|---|---|---|---|---|
| Bear | 32 % | 109.53 (-1 %) | 98.88 (-5 %) | 90.06 (-8 %) |
| Base | 53 % | 122.43 (+10 %) | 127.94 (+20 %) | 133.84 (+30 %) |
| Bull | 15 % | 138.66 (+24 %) | 156.86 (+45 %) | 176.30 (+67 %) |
| Weighted | 100 % | 120.74 (+8 %) | 122.98 (+15 %) | 126.20 (+23 %) |
What has to go right for MAA, and what could go wrong?
The base stays close to today’s valuation because supply and leasing improve gradually. The bear assumes delayed recovery and higher risk; the bull assumes broad supply absorption, stronger NOI and more durable growth.
| November 2027 | November 2028 | November 2029 | |
|---|---|---|---|
| Core AFFO | 899 (851 / 941) | 928 (827 / 1,000) | 959 (815 / 1,059) |
| Shares (millions) | 116 (117 / 115) | 116 (117 / 115) | 116 (118 / 114) |
| Dividends per share | 6.12 (6.12 / 6.20) | 6.20 (5.80 / 6.40) | 6.32 (5.80 / 6.64) |
| Price to Core AFFO | 15.80 (15.00 / 17.00) | 16.00 (14.00 / 18.00) | 16.20 (13.00 / 19.00) |
How much cash does MAA really make?
Core AFFO is an earnings measure, not a bank balance. Operating cash flow was $1.08 billion in 2025, but MAA also had to invest in its buildings. Its broader funds-available-for-distribution measure, or FAD, was $696.08 million. Dividends and partnership distributions paid were $727.25 million.
The company can draw on operating cash, asset sales, borrowing capacity or new equity. Each choice has a cost. Debt adds interest and must eventually be refinanced; issuing shares spreads future earnings across more owners. Diluted shares and partnership units rose to 120.00 million in 2025. They had been 118.519 million in 2021, so total earnings growth must be judged alongside per-share growth.
| 2025 | 2024 | 2023 | 2022 | 2021 | |
|---|---|---|---|---|---|
| AFFO (company's measure) | 913,008 | 952,757 | 986,435 | 910,038 | 749,509 |
| AFFO per share (company's measure) | 7.61 | 7.94 | 8.24 | 7.67 | 6.32 |
| Dividends paid | 709,024 | 686,900 | 651,717 | 539,605 | 470,401 |
| AFFO payout ratio | 79.8% | 74.6% | 68.8% | 65.0% | 65.9% |
What this means. The payout ratio uses dividends the trust declared, not necessarily the cash it paid that year, so it may not match dividends paid.
What does an investor pay for MAA today?
Ordinary earnings are a poor standalone guide because depreciation reduces reported profit even though it is not a quarterly cash payment. Funds from operations, or FFO, adds back real-estate depreciation and removes property-sale gains; adjusted FFO goes further by subtracting recurring maintenance spending. MAA trades at 14.24 times FFO and 15.73 times AFFO on the supplied measures. Its ordinary forward P/E is 31.9 times.