UDR stock forecast 2027–2029
MyStockButler's October 2026 analysis: The weighted path reaches $38.14 in October 2027 and $40.04 in October 2029, with 28% bear, 55% base and 17% bull probabilities. It hinges on turning Apollo’s capital into rent growth that outpaces expenses and refinancing costs.
Where could UDR's shares be by 2029?
The forecast share price reaches $38.14 in October 2027, before dividends. It reaches $38.75 in October 2028 and $40.04 in October 2029. The return is +11% at the first date and +18% at the second. It reaches +26% at the third.
The range remains wide. By October 2029, the bear case gives $28.62 while the bull case gives $54.96, compared with today’s $35.84. The consolidated probabilities are 28% bear, 55% base and 17% bull, reflecting stable AFFO but meaningful pressure on rents, costs and refinancing.
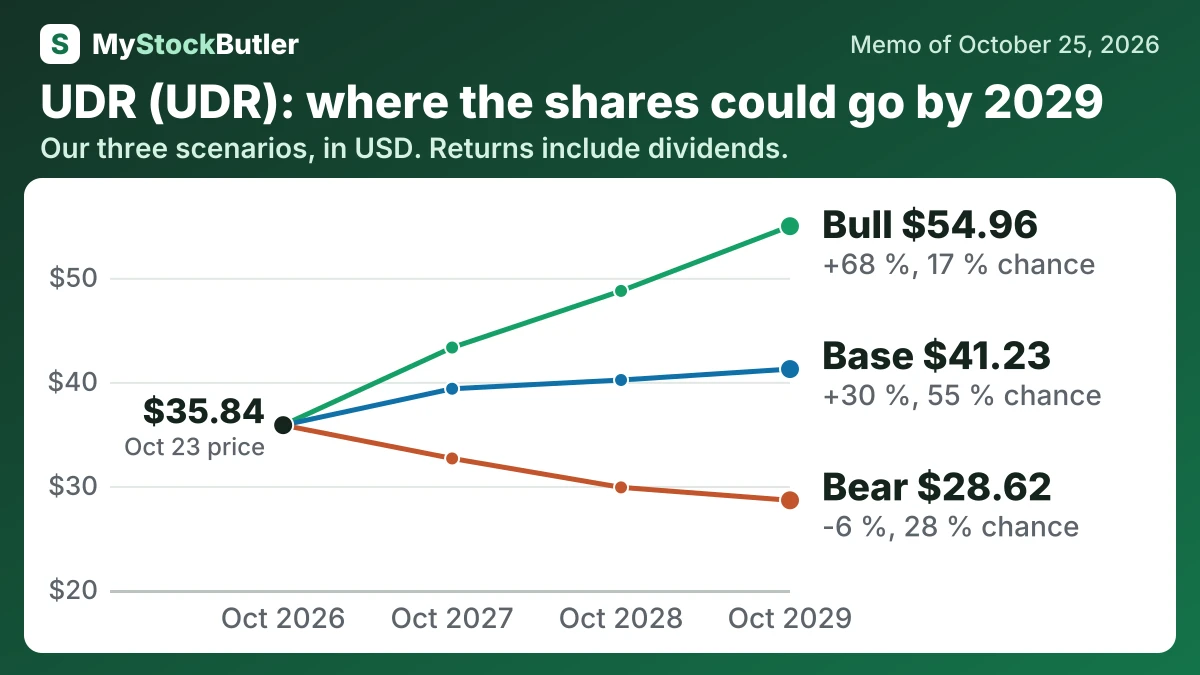
| Case | Probability | October 2027 | October 2028 | October 2029 |
|---|---|---|---|---|
| Bear | 28 % | 32.64 (-4 %) | 29.86 (-7 %) | 28.62 (-6 %) |
| Base | 55 % | 39.34 (+15 %) | 40.18 (+22 %) | 41.23 (+30 %) |
| Bull | 17 % | 43.30 (+26 %) | 48.74 (+46 %) | 54.96 (+68 %) |
| Weighted | 100 % | 38.14 (+11 %) | 38.75 (+18 %) | 40.04 (+26 %) |
What this means. The weighted row is a probability-based average of the three cases, not a promise that the share price will reach that amount.
What has to go right or wrong for UDR?
The bear case falls to $770 million, then $762 million, and remains at $762 million. That path reflects expenses growing faster than revenue, weaker rents in oversupplied markets and higher refinancing costs. The bull case rises to $822 million, then $859 million, and $902 million as supply eases, retention improves, developments lease up and Apollo capital reduces financing strain.
How much cash does UDR really make?
Cash flow provides a second test. In 2025, operating cash flow was about $902.9 million, while real-estate capital expenditure and major improvements were about $252.9 million. UDR also received $204.2 million of venture distributions, but only $53.9 million was classified as operating cash flow. The remainder was investing cash flow, meaning a distribution from an investment can support today’s dividend without proving a recurring operating source.
| 2025 | 2024 | 2023 | 2022 | 2021 | |
|---|---|---|---|---|---|
| AFFO (company's measure) | 792,608 | 780,074 | 783,792 | 731,381 | 594,977 |
| AFFO per share (company's measure) | 2.22 | 2.19 | 2.21 | 2.11 | 1.82 |
| Dividends paid | 567,864 | 558,482 | 539,852 | 483,624 | 433,780 |
| AFFO payout ratio | 77.5% | 77.6% | 76.0% | 72.0% | 79.7% |
What this means. The payout ratio uses dividends declared per share, not the total cash dividends paid shown in the table, so the numbers may not match exactly.
What does UDR's stock price pay for today?
FFO is the operating measure behind the stock’s 14.5x multiple. It adds real-estate depreciation back to accounting profit and removes property-sale gains, so apartment operations are easier to see. Depreciation is useful for accounting, but it assumes buildings wear out on a schedule even when their market values rise.
| Today (Oct 24, 2026) | |
|---|---|
| Share price | 35.84 |
| Market value (calculated) | 11,514,110 |
| Price to FFO (calculated) | 14.5x |
| Dividend yield (calculated) | 4.9% |
What this means. The market value counts only common shares, so it leaves out preferred shares and partnership units.