MAA earnings date and guidance
MyStockButler's November 2026 analysis: MAA's next results are expected on February 3, 2027. Watch new-lease pricing to see whether the recovery reaches comparable-property income.
What has MAA guided for 2026?
Management guides quarterly and full-year. For 2026, Core FFO per share is $8.43-$8.55. Core AFFO per share is $7.40-$7.52. Same-store NOI is forecast to decline between 0.8% and 1.7%. Effective rent is forecast from a 0.3% decline to 0.1% growth. Occupancy is forecast at 95.3%-95.5%. MAA met quarterly Core FFO guidance in all eight quarters checked, but lowered annual forecasts.
| Period guided | Low | High | Date given | |
|---|---|---|---|---|
| Core FFO per Share - diluted | Year to Dec 2026 | 8.43 | 8.55 | Oct 28, 2026 |
| Core AFFO per Share - diluted | Year to Dec 2026 | 7.40 | 7.52 | Oct 28, 2026 |
| Average physical occupancy | Year to Dec 2026 | 95.3% | 95.5% | Oct 28, 2026 |
| Same Store NOI (Core FFO per diluted Share change) | Quarter to Dec 2026 | 0.09 | 0.09 | Oct 28, 2026 |
Has MAA kept its past promises?
MAA met its quarterly Core FFO range in all eight quarters checked, but it also lowered its annual forecasts. That is a record of careful short-term guidance, not proof that the original annual outlook was unchanged.
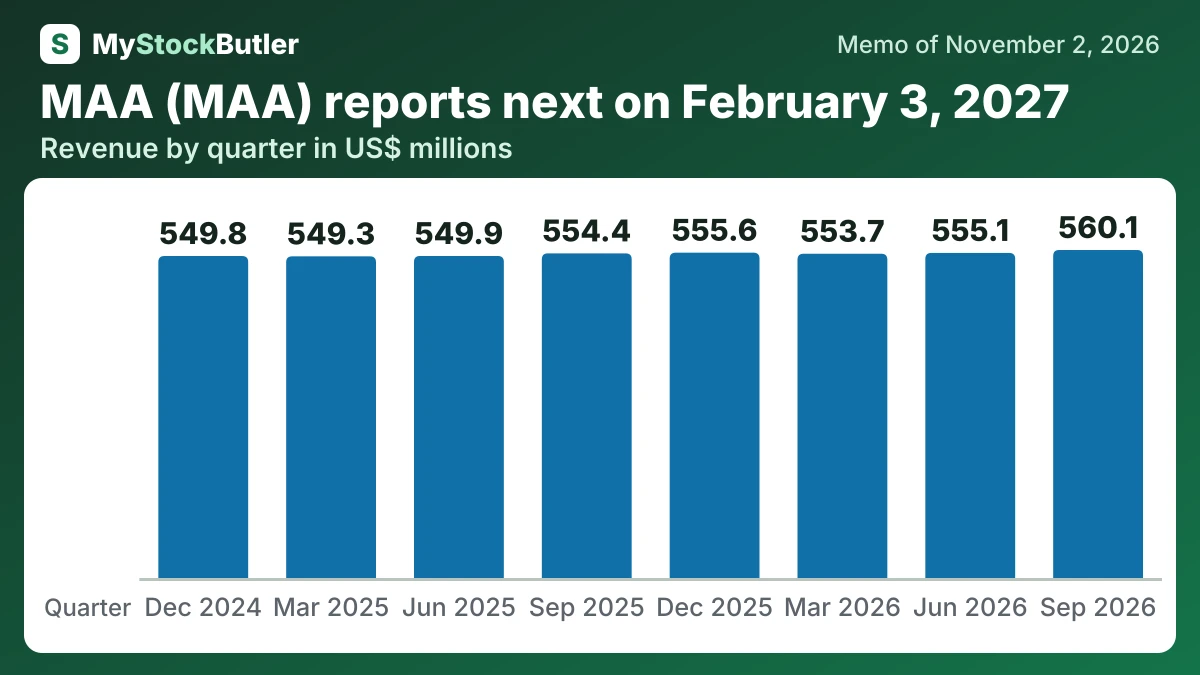
What is MAA's last eight-quarter revenue and profit trend?
Third-quarter 2026 revenue was $560.13 million, up about 1.0% from a year earlier. Total NOI slipped year over year. FFO per share fell to $2.11, while Core AFFO per share fell to $1.79. The quarterly dividend rose to $1.53, taking the Core AFFO payout ratio to 85.5%.
| Sep 2026 | Jun 2026 | Mar 2026 | Dec 2025 | Sep 2025 | Jun 2025 | Mar 2025 | Dec 2024 | |
|---|---|---|---|---|---|---|---|---|
| Revenue | 560,130 | 555,127 | 553,725 | 555,556 | 554,373 | 549,902 | 549,295 | 549,832 |
| FFO per share | 2.11 | 2.10 | 2.23 | 1.79 | 2.14 | 2.19 | 2.21 | 2.21 |
| AFFO per share (company's measure) | 1.79 | 1.77 | 1.98 | 1.91 | 1.81 | 1.85 | 2.04 | 2.03 |
| Dividend per share | 1.53 | 1.53 | 1.53 | 1.53 | 1.52 | 1.52 | 1.52 | 1.52 |
| Occupancy | 94.9% | 94.0% | 94.5% | 94.7% | 94.8% | 94.4% | 94.3% | 94.7% |
What this means. The company’s adjusted funds from operations uses its own definition, so it may not be directly comparable with other companies’ adjusted funds from operations.
What should MAA watchers look for in the next results?
First, watch October 2026 new-lease pricing and the fourth-quarter results. Management expected the first year-over-year improvement in new-lease pricing during 2026, but improvement means the decline becomes less severe; it does not necessarily mean a new resident pays more than the previous resident. Renewal pricing was up about 5.3% in the third quarter, while new-lease pricing remained down about 6%. Management also expected a slightly positive 2027 earn-in.
Second, watch refinancing terms and the June 2027 maturity. Comparable apartment REIT debt carried a weighted average coupon of 6.1% in September 2026. MAA also expects less interest to be capitalized in 2027. Capitalized interest is financing cost included in a building’s construction cost; as projects finish, more interest can appear directly in current earnings.