MAA dividend: payout and coverage
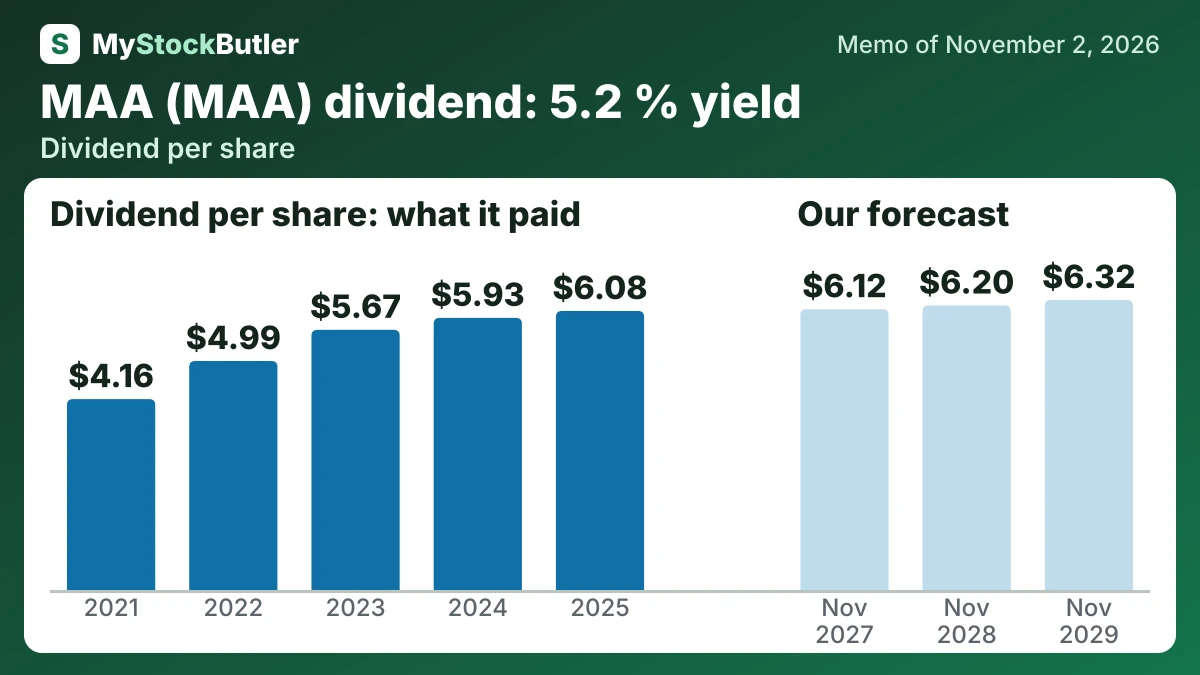
MyStockButler's November 2026 analysis: MAA paid a $1.53 quarterly dividend in the third quarter of 2026, and its 2025 declared dividend was $6.08 per share. Core AFFO was $7.61 per diluted share and unit against that $6.08 dividend, a 79.8% payout, while operating cash flow was $1.08 billion and dividends and partnership distributions paid were $727.25 million.
How much does MAA pay in dividends?
The third quarter of 2026 showed a mixed pivot. Revenue rose 1.0% to $560.13 million. FFO per share, a REIT earnings measure that adds back real-estate depreciation, was $2.11; Core AFFO per share, after recurring capital spending, was $1.79. Same-store revenue fell 0.4% and expenses rose 2.0%. Same-store NOI fell 1.8%. New-lease pricing fell 6.0%. Renewal pricing rose 5.3%, while blended pricing rose 0.4%. Occupancy was 94.9%. Preliminary October new-resident pricing improved from September, but the recovery has not reached comparable-property income. The dividend was $1.53 per share, putting Core AFFO payout at 85.5%.
In 2025, MAA deducted $135.38 million of recurring capital spending. Core AFFO was $913.01 million, or $7.61 per diluted share and unit. The per-share measure had fallen from $8.24 in 2023, while the declared dividend reached $6.08 in 2025. The declared-dividend payout ratio therefore reached 79.8%.
| 2025 | 2024 | 2023 | 2022 | 2021 | |
|---|---|---|---|---|---|
| AFFO per share (company's measure) | 7.61 | 7.94 | 8.24 | 7.67 | 6.32 |
| Dividend per share | 6.08 | 5.93 | 5.67 | 4.99 | 4.16 |
| AFFO payout ratio | 79.8% | 74.6% | 68.8% | 65.0% | 65.9% |
What this means. The dividend payout percentage uses the company’s own adjusted profit measure and dividends declared, so it may differ from percentages based on net income or cash actually paid.
Is MAA's dividend covered by its cash?
Core AFFO is an earnings measure, not a bank balance. Operating cash flow was $1.08 billion in 2025, but MAA also had to invest in its buildings. Its broader funds-available-for-distribution measure, or FAD, was $696.08 million. Dividends and partnership distributions paid were $727.25 million.
| 2025 | 2024 | 2023 | 2022 | 2021 | |
|---|---|---|---|---|---|
| Cash from operations | 1,078,175 | 1,098,292 | 1,137,187 | 1,058,479 | 894,967 |
| − Dividends paid | 709,024 | 686,900 | 651,717 | 539,605 | 470,401 |
| = Operating cash after dividends | 369,151 | 411,392 | 485,470 | 518,874 | 424,566 |
| − Development and capital spending | 632,268 | 636,260 | 539,376 | 468,300 | 511,277 |
| + Debt issued | 823,416 | 1,091,646 | 475,000 | 20,000 | 594,423 |
| − Debt repaid | 400,000 | 645,000 | 353,861 | 126,401 | 639,153 |
What this means. “Operating cash after dividends” is not the final cash left over, because the company still spends money on purchases, property improvements, and debt payments afterward.
What could change MAA's dividend?
The base dividend reflects coverage and MAA’s history of annual increases, but the payout ratio had reached 85.5% by September 2026. The bear case recognizes that debt maturities and weak NOI could reduce cash headroom, while the bull case requires recovering rents and project income.
| November 2027 | November 2028 | November 2029 | |
|---|---|---|---|
| Core AFFO | 899 (851 / 941) | 928 (827 / 1,000) | 959 (815 / 1,059) |
| Shares (millions) | 116 (117 / 115) | 116 (117 / 115) | 116 (118 / 114) |
| Dividends per share | 6.12 (6.12 / 6.20) | 6.20 (5.80 / 6.40) | 6.32 (5.80 / 6.64) |
| Price to Core AFFO | 15.80 (15.00 / 17.00) | 16.00 (14.00 / 18.00) | 16.20 (13.00 / 19.00) |
What is MAA's dividend yield today?
MAA’s 5.2% dividend yield offers income today, but it is not a promised return. The 2026 Core AFFO forecast is $7.46 per share against a $6.12 dividend, leaving about $1.34 under MAA’s recurring-capital definition.