Roper stock forecast 2027–2029
MyStockButler's October 2026 analysis: Roper’s weighted forecast reaches $514.27 by October 2029, with the bear case carrying 27% probability, base 58% and bull 15%. It hinges on organic growth, acquisition returns and cash flow per share that supports its debt burden.
Where could Roper’s shares go?
Roper’s October 2029 price could range from $298.61 to $777.03, hinging on organic growth, acquisition returns and cash flow per share that supports its debt burden. The starting price is $436.23.
The weighted forecast reaches $440.87 by October 2027, a 2% return including dividends. By October 2029, it reaches $514.27, a 21% return. The bear case carries 27% probability; base and bull carry 58% and 15%.
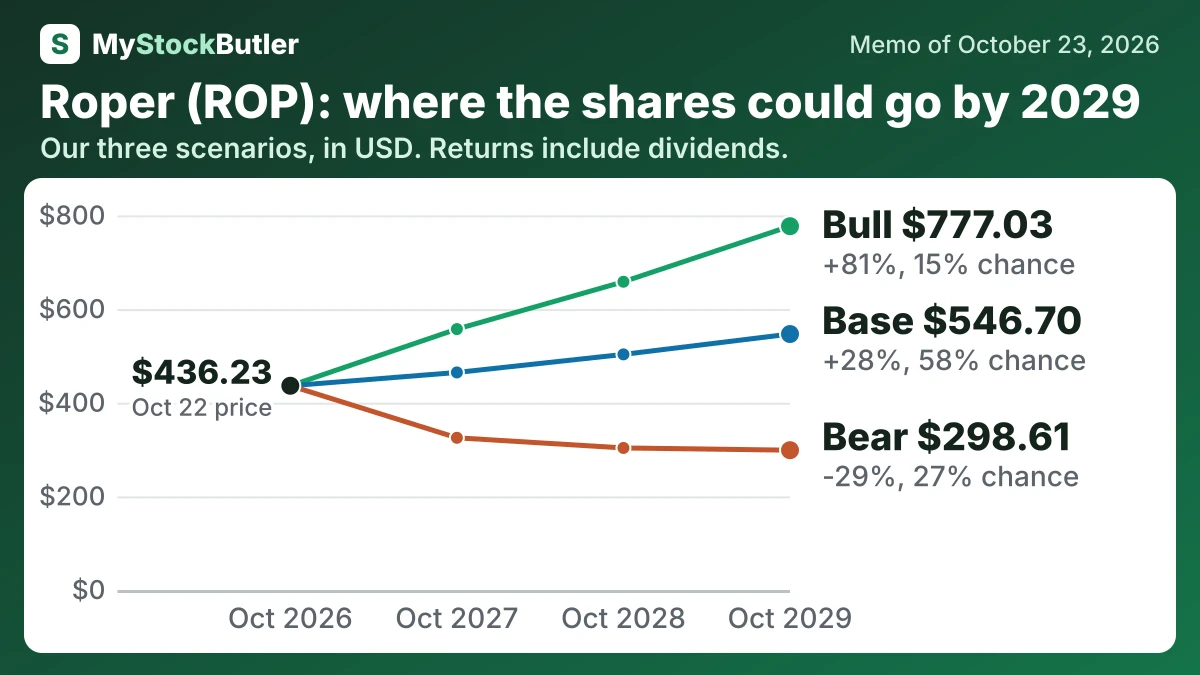
| Case | Probability | October 2027 | October 2028 | October 2029 |
|---|---|---|---|---|
| Bear | 27% | 325.08 (-25%) | 303.40 (-29%) | 298.61 (-29%) |
| Base | 58% | 464.66 (+7%) | 503.25 (+17%) | 546.70 (+28%) |
| Bull | 15% | 557.30 (+29%) | 658.39 (+53%) | 777.03 (+81%) |
| Weighted | 100% | 440.87 (+2%) | 472.56 (+10%) | 514.27 (+21%) |
What has to go right for Roper, and what could go wrong?
Q4 2026 tests whether the pump sale closes, expected cash arrives, collections recover and annual guidance holds. From April 1, 2028, Costpoint cloud migration must show customer conversions and customers staying through the end of new on-premises features and updates. Across 2027–2028, AI bookings must become repeat paid usage, while acquisitions produce cash flow per share and leverage falls.
How much cash does Roper really make?
Stock compensation complicates the picture. Roper recorded $166.3 million of stock compensation in 2025. It does not leave the company as immediate cash, but it gives employees an economic claim on the company and can dilute shareholders. Subtracting it produces analytical “real free cash flow” of roughly $2.3 billion.
| 2025 | 2024 | 2023 | 2022 | 2021 | |
|---|---|---|---|---|---|
| Cash from operations | 2,540.3 | 2,393.2 | 2,037.4 | 606.6 | 1,655.8 |
| − Capital spending | 47.4 | 66.0 | 68.0 | 40.1 | 28.5 |
| = Free cash flow | 2,492.9 | 2,327.2 | 1,969.4 | 566.5 | 1,627.3 |
| − Stock pay | 166.3 | 145.9 | 123.5 | 118.5 | 123.0 |
| = Real free cash flow | 2,326.6 | 2,181.3 | 1,845.9 | 448.0 | 1,504.3 |
What does an investor pay for Roper today?
Free cash flow is a better starting point for valuation because it measures cash remaining after operating needs and capital spending. But Roper can use that cash to repay debt, buy companies, repurchase shares or pay dividends, so it is financial capacity rather than cash shareholders can always withdraw.
| Today (Oct 23, 2026) | |
|---|---|
| Share price | 436.23 |
| Market value (calculated) | 43,186.8 |
| Enterprise value (calculated) | 52,595.5 |
| P/E, last 12 months (calculated) | 17.2x |
| Free cash flow yield (calculated) | 5.8% |
| Real free cash flow yield (calculated) | 5.4% |