Trimble stock forecast 2027–2029
MyStockButler's October 2026 analysis: Trimble's weighted forecast reaches $77.30 by October 2029, a 22% return including dividends. The investment turns on whether Trimble converts connected products into durable ARR, renewals, and cash.
Where could Trimble's shares be by October 2029?
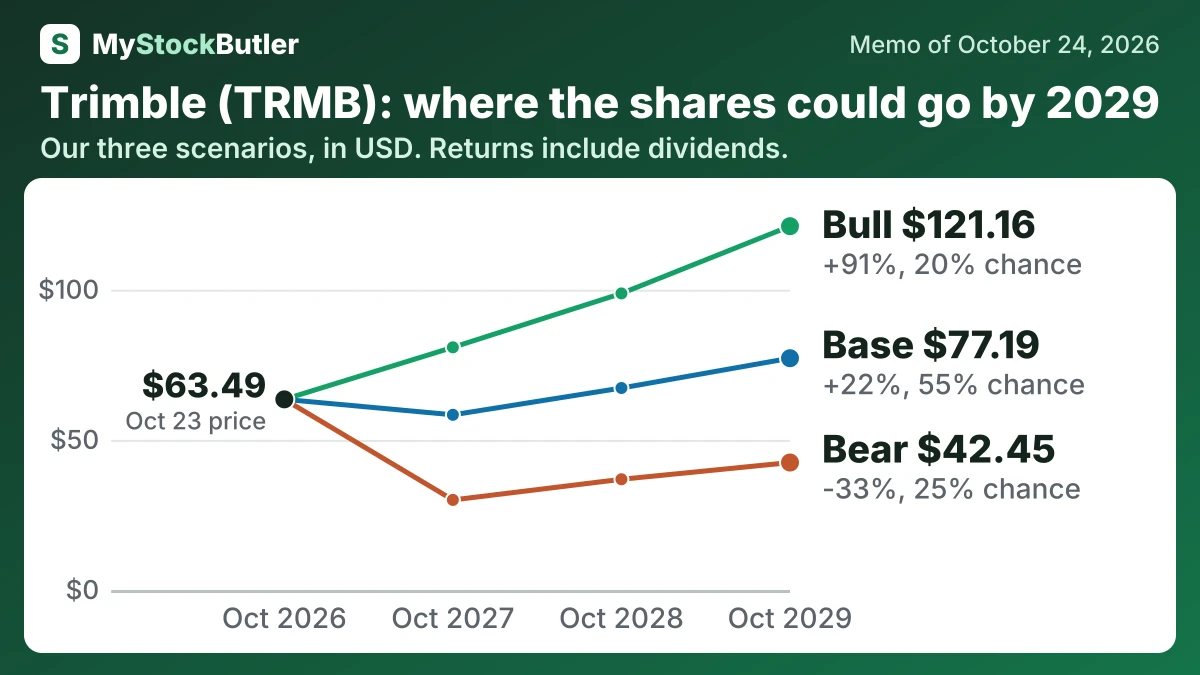
The first weighted price is $55.75 in October 2027, a -12% return. The terminal weighted price is $77.30 by October 2029, with a +22% return. The bear case has a 25% probability. The base case is 55%, and the bull case is 20%.
The forecast points to a weak first year, a modest second year, and a stronger three-year outcome. The probability-weighted price is $55.75 in October 2027, a negative 12% total return including dividends. It rises to $65.97 in October 2028, a 4% return. By October 2029, it reaches $77.30, a 22% return.
| Case | Probability | October 2027 | October 2028 | October 2029 |
|---|---|---|---|---|
| Bear | 25% | 30.00 (-53%) | 36.88 (-42%) | 42.45 (-33%) |
| Base | 55% | 58.34 (-8%) | 67.27 (+6%) | 77.19 (+22%) |
| Bull | 20% | 80.82 (+27%) | 98.77 (+56%) | 121.16 (+91%) |
| Weighted | 100% | 55.75 (-12%) | 65.97 (+4%) | 77.30 (+22%) |
What has to go right for Trimble's forecast?
The multiple starts below software-oriented reference points because Trimble still has hardware cyclicality, acquisition-integration risk, leverage, limited retention disclosure, and a Field Systems transition. The base case expands the multiple gradually as those risks ease. The bear case assumes a discount; the bull case assumes execution earns a premium.
The base case assumes cash generation improves, but does not assume unusually strong conversion. After-stock-pay cash flow rises from $624 million to $701 million. The bear path ends at $509 million, reflecting a 0.70-times conversion year and weaker renewals. The bull path reaches $835 million because conversion reaches 1.0 times and Field Systems succeeds. Management’s 0.9-times cash-conversion guide, recurring-revenue targets, and record of meeting operating guidance support the base case.
How much cash does Trimble really make?
Market value is $14.8 billion and enterprise value is $16.0 billion. The valuation is 17.3x next-twelve-month P/E. Buyback yield is 5.8%, while dividend yield is 0.0%; last-twelve-month P/E is not meaningful. Subscription and services grew 9% organically in fiscal 2025 as product revenue fell 1%. Trimble’s reported free cash flow was $360.9 million in fiscal 2025. Excluding the $277.4 million Agriculture-sale tax payment, the adjusted comparison is $638.3 million. Net debt was $1,138.8 million at January 2026. Diluted shares fell 2.3%, and buybacks were $3.58 per share.
| October 2027 | October 2028 | October 2029 | |
|---|---|---|---|
| Free cash flow after stock pay | 624 (441 / 697) | 661 (485 / 759) | 701 (509 / 835) |
| Shares (millions) | 231 (235 / 229) | 229 (236 / 224) | 227 (238 / 218) |
| Dividends per share | 0.00 (0.00 / 0.00) | 0.00 (0.00 / 0.00) | 0.00 (0.00 / 0.00) |
| Enterprise value to free cash flow after stock pay | 23.00 (18.00 / 28.00) | 24.00 (19.00 / 30.00) | 25.00 (20.00 / 32.00) |
| Net debt | 864 (897 / 991) | 446 (505 / 675) | -12.00 (89.00 / 283) |
What does an investor pay for Trimble today?
| Today (Oct 24, 2026) | |
|---|---|
| Share price | 63.49 |
| Market value (calculated) | 14,804.6 |
| Enterprise value (calculated) | 16,049.5 |
| P/E, next 12 months (calculated) | 17.3x |
| Price to book (calculated) | 2.9x |
| Dividend yield (calculated) | 0.0% |
What this means. The last twelve months price-to-earnings number is not meaningful because the company lost money, while the next twelve months number uses analysts’ expected profit.