Verisk stock forecast 2027–2029
MyStockButler's October 2026 analysis: Verisk's weighted scenario reaches $213.05 per share in October 2029, after $168.62 per share in October 2027. It hinges on subscription growth and renewal value outweighing weak transactions, debt and AccuLynx risk.
Where could Verisk's shares be by October 2029?
The weighted value is $168.62 per share in October 2027, a −11% return including dividends. It reaches $213.05 in October 2029, a +15% return including dividends. The bear case has 25% probability. The base case has 55%. The bull case has 20%.
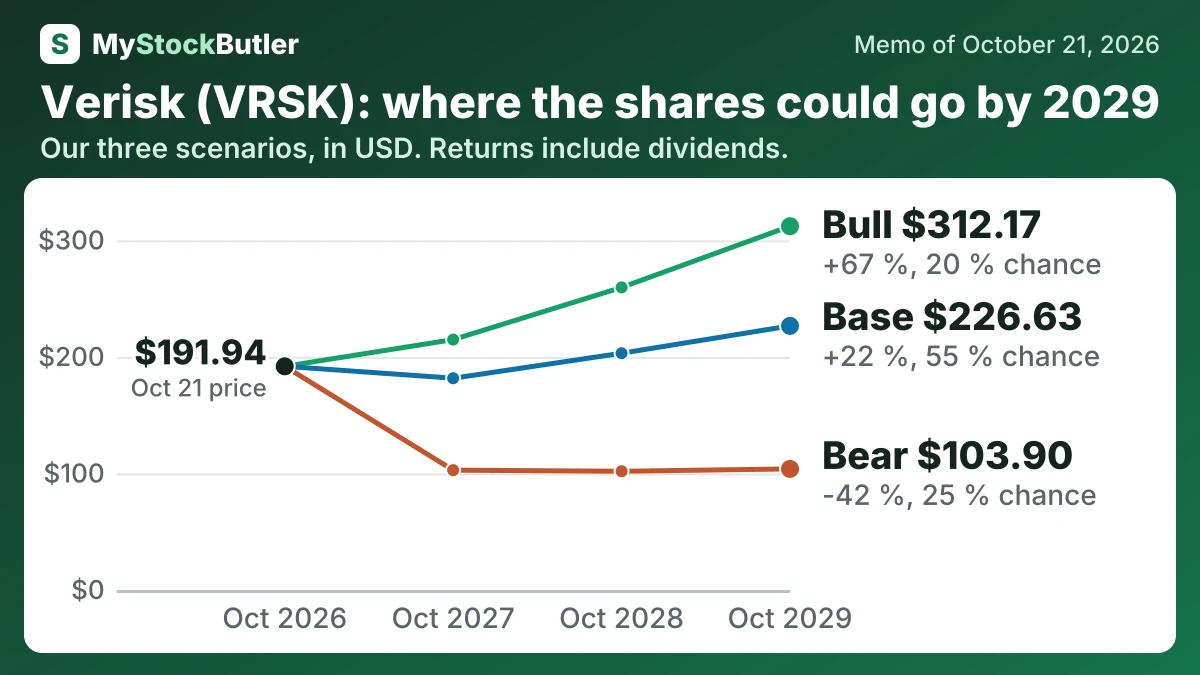
| Case | Probability | October 2027 | October 2028 | October 2029 |
|---|---|---|---|---|
| Bear | 25 % | 102.83 (-45 %) | 101.89 (-45 %) | 103.90 (-42 %) |
| Base | 55 % | 181.71 (-4 %) | 203.18 (+8 %) | 226.63 (+22 %) |
| Bull | 20 % | 214.87 (+13 %) | 259.64 (+38 %) | 312.17 (+67 %) |
| Weighted | 100 % | 168.62 (-11 %) | 189.15 (+1 %) | 213.05 (+15 %) |
What this means. The weighted row is the average value after giving each case more or less influence based on its probability.
What has to go right, and what could go wrong for Verisk?
Free cash flow is the central operating assumption. The latest half produced $624.3 million before stock pay, while FY2025 free cash flow after stock pay was $1,137.7 million. The base case therefore uses the middle path shown in the table, with growth supported by subscriptions, renewal pricing and gradual margin improvement. Subscriptions were 83% of revenue and grew 9.1% organically, while transactional revenue fell 4.3%.
The bear case stays near recent cash generation, then weakens as transactions remain soft and AccuLynx funding competes for cash. The bull case assumes migrations, Core Lines Reimagine, paid AI use and a claims recovery convert into stronger operating leverage. Management’s organic revenue target is 6%–8%, but the record does not make the aggressive cash-flow path dependable.
How much cash does Verisk really make?
Stock compensation was $54.2 million in 2025. After treating that issuance as an ownership cost, calculated real free cash flow was $1,137.7 million. The $1.80 dividend per share in 2025 was well covered by cash generation, but cash must also support debt and software investment.
| 2025 | 2024 | 2023 | |
|---|---|---|---|
| Cash from operations | 1,436.0 | 1,144.0 | |
| − Capital spending | 244.1 | 223.9 | 223.5 |
| = Free cash flow | 1,191.9 | 920.1 | |
| − Stock pay | 54.2 | 47.9 | |
| = Real free cash flow | 1,137.7 | 872.2 | |
| Real free cash flow, % of revenue | 37.0% | 30.3% |
What this means. The company's own free cash flow is higher because it does not subtract shares given to employees as pay, which reduce each shareholder's ownership.
What does an investor pay for Verisk today?
The trailing P/E is 29.5x, meaning investors pay US$29.50 for each dollar of recent earnings. The forward P/E is 22.1x, but it relies on forecasts. Free cash flow yield is 4.8%, while the dividend yield is 1.0%, so much of the case depends on retained cash and repurchases. The cash yield also sits below the 10-year U.S. Treasury yield of 5.12% on October 20, 2026.
| Today (Oct 21, 2026) | |
|---|---|
| Share price | 191.935 |
| Market value (calculated) | 24,981.5 |
| Enterprise value (calculated) | 28,902.8 |
| P/E, last 12 months (calculated) | 29.5x |
| P/E, next 12 months (calculated) | 22.1x |
| Free cash flow yield (calculated) | 4.8% |
What this means. The price to book ratio is not meaningful because the company owes more than it owns on its balance sheet.