Tyler stock forecast 2027–2029
MyStockButler's October 2026 analysis: Tyler's weighted forecast is $472.61 in October 2029, after $360.71 in October 2027. It hinges on whether Tyler can turn cloud conversion into durable cash per share.
Where could Tyler's shares be by 2029?
The weighted forecast is $360.71 in October 2027, a 3% decline. It is $472.61 in October 2029, a 28% gain. Bear probability is 30%. Base probability is 52%, and bull probability is 18%.
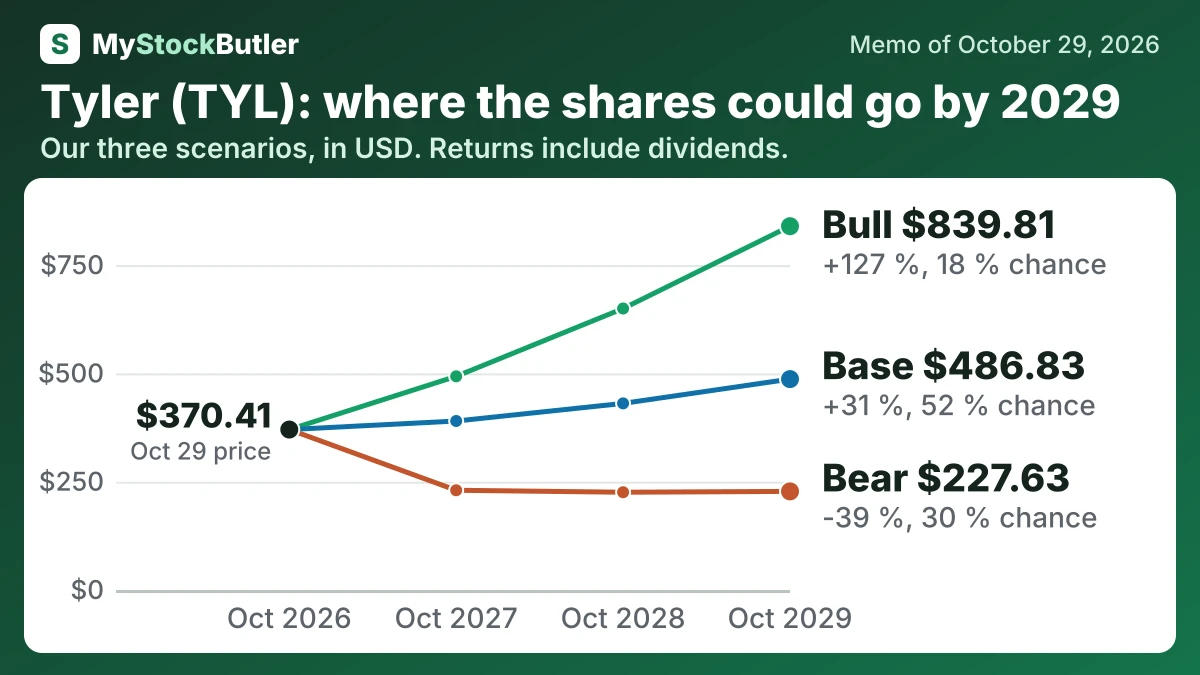
| Case | Probability | October 2027 | October 2028 | October 2029 |
|---|---|---|---|---|
| Bear | 30 % | 230.22 (-38 %) | 225.69 (-39 %) | 227.63 (-39 %) |
| Base | 52 % | 390.13 (+5 %) | 430.80 (+16 %) | 486.83 (+31 %) |
| Bull | 18 % | 493.23 (+33 %) | 649.77 (+75 %) | 839.81 (+127 %) |
| Weighted | 100 % | 360.71 (-3 %) | 408.68 (+10 %) | 472.61 (+28 %) |
What has to go right for Tyler, and what could go wrong?
Base after-stock-pay free cash flow rises from $531 million in October 2027 to $671 million in October 2029. Its assumed margin moves from 19.3% to 21.3%. The bear case stays below the 2025 margin because delayed go-lives and migration costs persist. The bull case assumes Cloud Living, paid AI, and standardization lift both growth and margins. SaaS grew 21.2% in the latest quarter, while total revenue grew 8.7%. Management retained a 26%–28% 2026 free-cash-flow-margin outlook and targets $1.1–$1.2 billion of annual free cash flow in 2030, but those are targets.
Late government implementations and costly migrations slow SaaS conversion, while the Texas contract wind-down shows how transaction exposure can matter. AI contributes little, buybacks provide less support after new borrowing, and the multiple contracts. The bear price is $230.22 in October 2027 and $227.63 in October 2029. Its probability is 30% because the downside requires several years of weak conversion, but Tyler's recurring revenue and retention limit the risk of a complete breakdown.
| October 2027 | October 2028 | October 2029 | |
|---|---|---|---|
| Free cash flow after stock pay | 531 (421 / 571) | 590 (440 / 680) | 671 (475 / 809) |
| Shares (millions) | 38.28 (38.82 / 37.83) | 37.57 (38.57 / 36.39) | 36.97 (38.33 / 35.64) |
| Dividends per share | 0.00 (0.00 / 0.00) | 0.00 (0.00 / 0.00) | 0.00 (0.00 / 0.00) |
| Enterprise value to free cash flow after stock pay | 29.00 (22.00 / 34.00) | 28.00 (20.00 / 36.00) | 27.00 (18.00 / 38.00) |
| Net debt | 465 (325 / 755) | 335 (95.00 / 835) | 119 (-175 / 811) |
How much cash does Tyler really make?
After capital spending, free cash flow was $637.5 million. Tyler’s own measure also deducts capitalized software development, producing a lower figure. Software development is real cash invested in the product, even though accounting rules initially place it on the balance sheet.
Stock compensation requires a separate judgment. It is not an immediate cash expense, but it gives employees ownership and can dilute existing shareholders when new shares are issued. Deducting stock pay from free cash flow is therefore an analytical allowance for the cost of paying with equity, not a second cash payment.
| 2025 | 2024 | 2023 | 2022 | 2021 | |
|---|---|---|---|---|---|
| Cash from operations | 653,543 | 624,633 | 380,440 | 381,455 | 371,753 |
| − Capital spending | 16,015 | 20,535 | 20,519 | 22,529 | 33,919 |
| = Free cash flow | 637,528 | 604,098 | 359,921 | 358,926 | 337,834 |
| − Stock pay | 151,276 | 122,813 | 108,338 | 102,985 | 104,726 |
| = Real free cash flow | 486,252 | 481,285 | 251,583 | 255,941 | 233,108 |
| Real free cash flow, % of revenue | 20.8% | 22.5% | 12.9% | 13.8% | 14.6% |
What this means. Tyler's own free cash flow is lower because it also subtracts money spent developing software, while our count subtracts only equipment and buildings.