Roper dividend: cash coverage and yield
MyStockButler's October 2026 analysis: Roper's latest quarterly dividend rose from $0.825 to $0.91, and its base forecast rises from $4.00 to $4.84 per share. The dividend was about 14% of 2025 free cash flow, which was $2.5 billion.
How much does Roper pay per share?
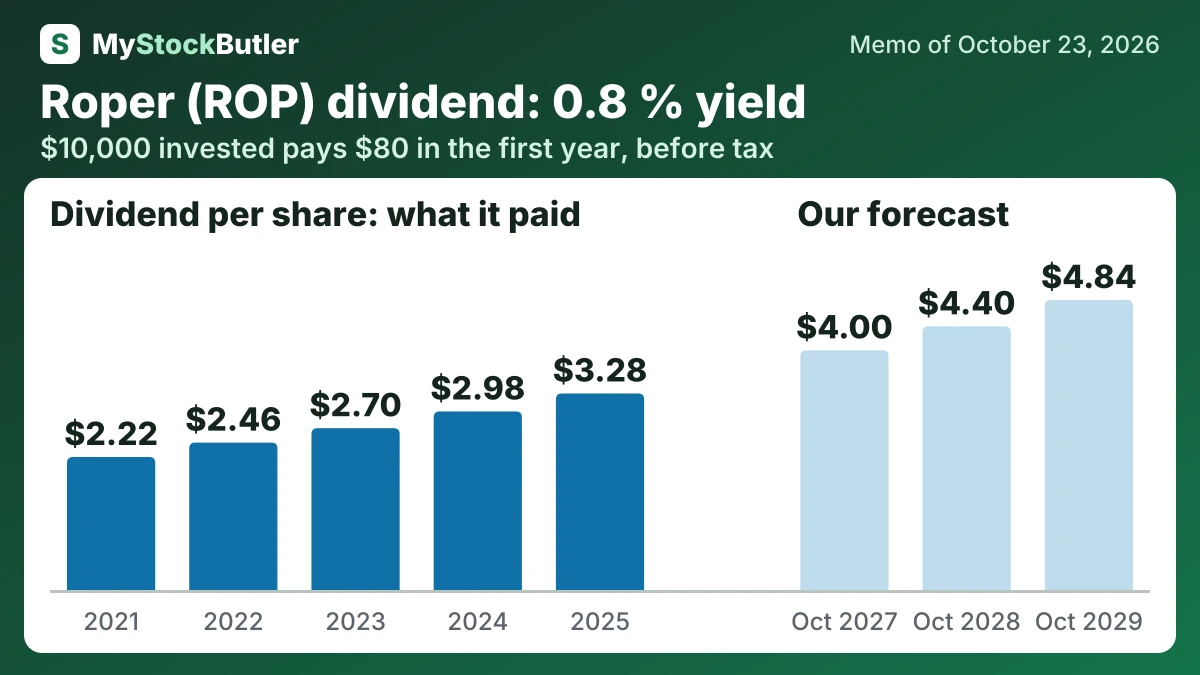
Dividends rise from $4.00 per share to $4.40 and then $4.84 in the base case. That path follows the latest 10% increase from $0.825 to $0.91 per quarter. The bear case holds annual dividends at $3.64, while the bull case reaches $5.29 through 15% increases. The base is supported by a long record of increases and a payout equal to about 14% of 2025 free cash flow.
| 2025 | 2024 | 2023 | 2022 | 2021 | |
|---|---|---|---|---|---|
| Free cash flow per share | 23.04 | 21.55 | 18.34 | 5.30 | 15.28 |
| − Dividends paid, per share | 3.28 | 2.98 | 2.70 | 2.46 | 2.22 |
| = FCF not paid out, per share | 15.14 | 18.57 | 15.64 | 2.85 | 13.06 |
How much would Roper's dividend pay you?
$10,000 invested in Roper at its 0.8% dividend yield (our report of October 23, 2026) pays $80.00 in the first year, before tax. If its dividend per share keeps changing 10.3% a year, as it did from 2021 to 2025, and the dividends are reinvested, year 10 pays $214.73, with $1,367.26 received in all.
Before tax. Past dividend growth is not a promise. Information only, not investment advice.
Does Roper's cash cover its dividend?
Free cash flow is cash from operations after conventional capital spending. It rose from $1.6 billion in 2021 to $2.5 billion in 2025, but fell to $566.5 million in 2022 because disposal-related cash taxes depressed operating cash. Asset sales brought in money elsewhere, so one cash-flow measure looked weak while the overall financing capacity remained substantial.
The table shows why acquisitions could exceed free cash flow. In 2025, operations generated $2.5 billion but acquisitions absorbed $3.3 billion. Roper issued $2.0 billion of notes and borrowed $725 million on its revolving credit facility, a reusable borrowing arrangement. Year-end net debt reached $9.0 billion, so the new businesses must eventually produce enough cash to support both their prices and their financing burden.
| 2025 | 2024 | 2023 | 2022 | 2021 | |
|---|---|---|---|---|---|
| Free cash flow | 2,492.9 | 2,327.2 | 1,969.4 | 566.5 | 1,627.3 |
| − Dividends paid | 355.0 | 321.9 | 290.2 | 262.3 | 236.4 |
| − Share buybacks | 500.0 | 0.0 | 0.0 | 0.0 | 0.0 |
| = Free cash flow not paid out | 1,637.9 | 2,005.3 | 1,679.2 | 304.2 | 1,390.9 |
| Paid out, % of free cash flow | 34.3% | 13.8% | 14.7% | 46.3% | 14.5% |
What this means. The acquisition amounts are cash spent on other businesses, not percentage points of revenue growth as the last note says, so that note conflicts with the table.
What could change Roper's dividend?
The bear case becomes more likely in 2027–2028 if Costpoint customers delay migration or leave as on-premises support winds down. It also gains weight through 2029 if acquisition returns lag underwriting, debt rises faster than cash flow, or Indicor gains normalize.
| October 2027 | October 2028 | October 2029 | |
|---|---|---|---|
| Net asset value | 20,593 (20,033 / 20,663) | 21,983 (19,883 / 22,103) | 23,533 (20,903 / 23,803) |
| Shares (millions) | 97.50 (98.60 / 96.40) | 96.10 (98.30 / 94.00) | 94.70 (98.00 / 91.90) |
| Dividends per share | 4.00 (3.64 / 4.00) | 4.40 (3.64 / 4.60) | 4.84 (3.64 / 5.29) |
| Price to net asset value | 2.20 (1.60 / 2.60) | 2.20 (1.50 / 2.80) | 2.20 (1.40 / 3.00) |