PG&E stock forecast 2027–2029
MyStockButler's October 2026 analysis: PG&E's weighted forecast is $15.26 in October 2027 and $17.91 in October 2029, including dividends. PG&E's outcome hinges on projects entering approved rate base on schedule and large-load plans becoming connected demand.
Where could PG&E's shares go?
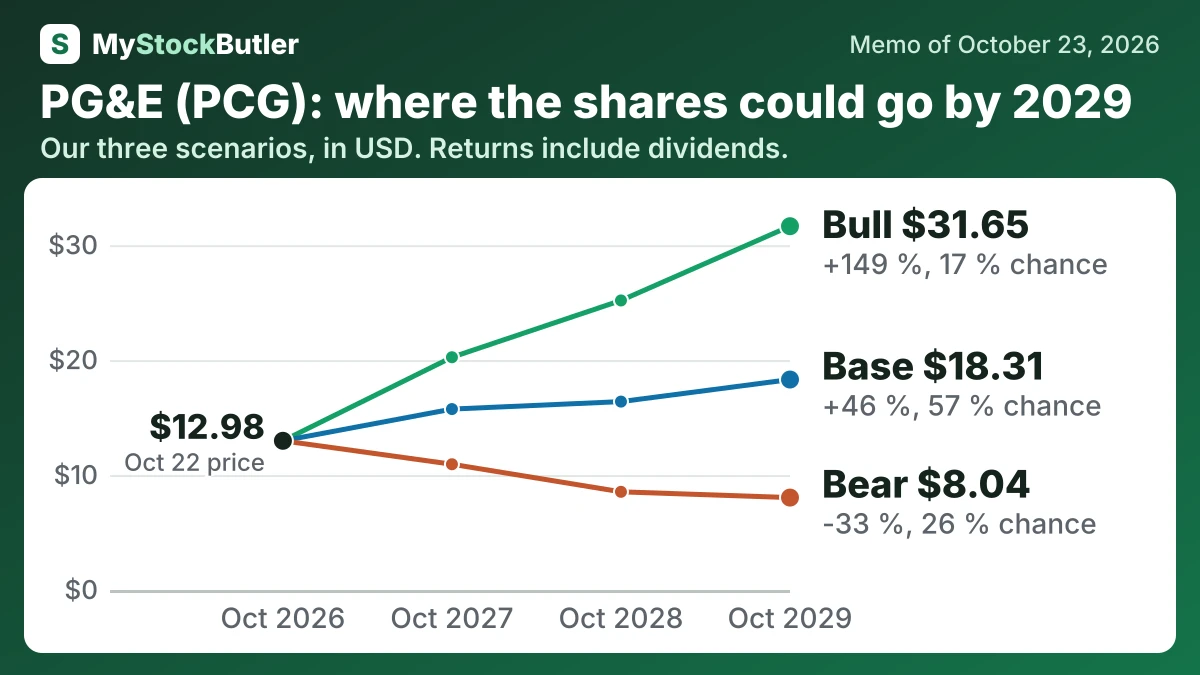
The weighted forecast is $15.26 in October 2027, a 19% return including dividends, and $17.91 in October 2029, a 43% return. The bear, base, and bull cases carry 26%, 57%, and 17% probabilities.
| Case | Probability | October 2027 | October 2028 | October 2029 |
|---|---|---|---|---|
| Bear | 26 % | 10.94 (-14 %) | 8.54 (-31 %) | 8.04 (-33 %) |
| Base | 57 % | 15.74 (+23 %) | 16.39 (+29 %) | 18.31 (+46 %) |
| Bull | 17 % | 20.25 (+58 %) | 25.19 (+97 %) | 31.65 (+149 %) |
| Weighted | 100 % | 15.26 (+19 %) | 15.84 (+25 %) | 17.91 (+43 %) |
What has to go right for PG&E, and what could go wrong?
The base P/E is 9.0x in 2027 and 2028, then 9.5x in 2029. The bear compresses from 7.0x to 5.5x as wildfire and refinancing risks persist. The bull expands from 11.0x to 15.0x as execution reduces the risk discount. PG&E remains below most supplied utility peers because debt and wildfire exposure remain unresolved.
The bull case requires favorable wildfire treatment, timely recovery, stronger funding access and large-load projects moving into construction and service. The price reaches $20.25 first and $31.65 by October 2029. Its probability is 17% because several regulatory and execution milestones must align, while only 174 MW of the reported pipeline had come online since 2024.
| October 2027 | October 2028 | October 2029 | |
|---|---|---|---|
| Earnings | 3,860 (3,450 / 4,060) | 4,150 (3,400 / 4,400) | 4,400 (3,500 / 4,800) |
| Shares (millions) | 2,207 (2,207 / 2,205) | 2,279 (2,389 / 2,271) | 2,283 (2,393 / 2,275) |
| Dividends per share | 0.20 (0.20 / 0.20) | 0.22 (0.20 / 0.24) | 0.24 (0.20 / 0.28) |
| Price to earnings | 9.00 (7.00 / 11.00) | 9.00 (6.00 / 13.00) | 9.50 (5.50 / 15.00) |
How much cash does PG&E really make?
Construction is the central fact. In 2025, PG&E spent more on capital projects than its operations generated, producing negative free cash flow. Deducting stock compensation makes the ownership cost more visible because shares issued to employees dilute other shareholders. The deficit widened as capital spending rose faster than operating cash.
| 2025 | 2024 | 2023 | 2022 | 2021 | |
|---|---|---|---|---|---|
| Cash from operations | 8,716 | 8,035 | 4,747 | 3,721 | 2,262 |
| − Capital spending | 11,787 | 10,369 | 9,714 | 9,584 | 7,689 |
| = Free cash flow | -3,071 | -2,334 | -4,967 | -5,863 | -5,427 |
| − Stock pay | 134 | 98 | 91 | 115 | 56 |
| = Real free cash flow | -3,205 | -2,432 | -5,058 | -5,978 | -5,483 |
What this means. Real free cash flow is lower because shares given to employees reduce shareholders’ ownership even though no cash was paid.
What does an investor pay for PG&E today?
The forward P/E of 7.2x implies roughly $1.80 of next-twelve-month earnings per share. That is close to the midpoint of reaffirmed 2027 core-earnings guidance of $1.78–$1.82, so the price does not require a forecast far above management’s near-term target.