Edison stock forecast 2027–2029
MyStockButler's October 2026 analysis: The weighted forecast for Edison is $56.76 per share in October 2027, a 2% return. It hinges on wildfire costs and recovery, financing, and whether approved grid spending earns returns.
Where could Edison’s shares be by 2029?
Edison guides to core EPS of $5.90–$6.20 in 2026 and $6.25–$6.65 in 2027. It targets 5%–7% annual growth through 2030, when core EPS guidance is $7.45–$8.20. Management’s core-EPS record was above or within its initial range in all five checked years. Our weighted forecast is $56.76 per share in October 2027, a 2% return. It reaches $67.66 in October 2029, a 33% return. The cases carry 30% bear, 55% base, and 15% bull probabilities. The outcome turns on wildfire costs and recovery, financing, and whether approved grid spending earns returns. Eaton bellwether trials—early court cases that test claims and guide similar cases—are scheduled for January 2027. SCE’s next rate-case decision is expected in May 2028. Edison is a regulated grid investment story whose upside depends on turning approved spending into earnings without letting wildfire liabilities overwhelm cash flow.
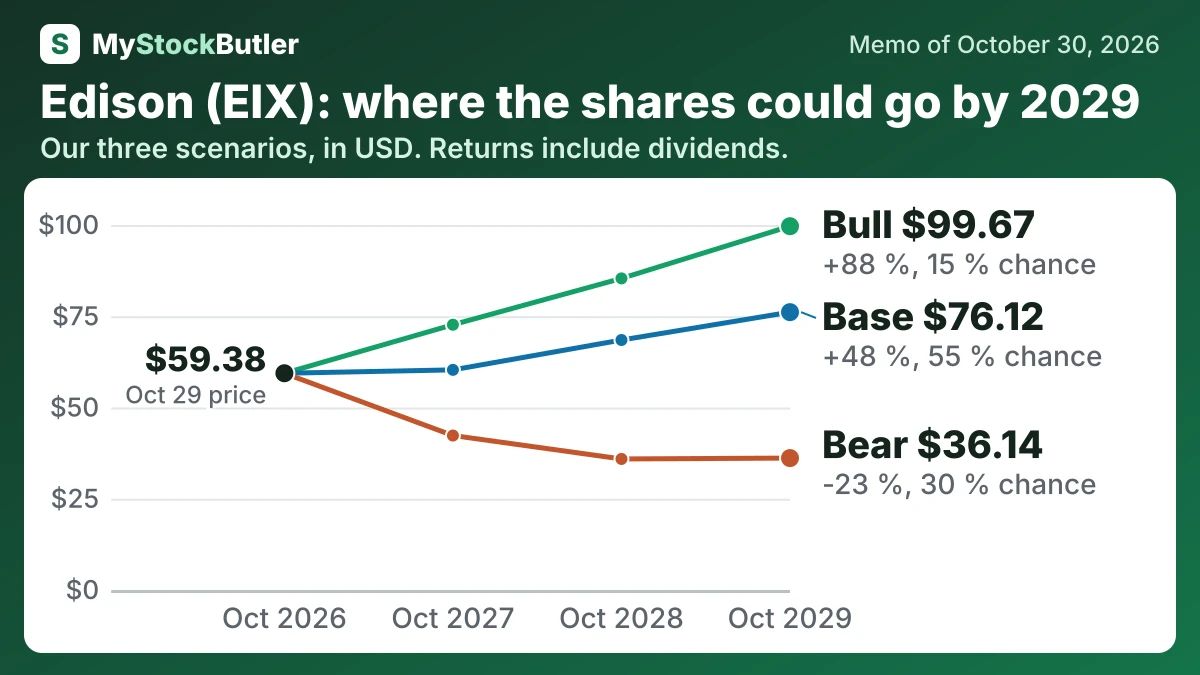
| Case | Probability | October 2027 | October 2028 | October 2029 |
|---|---|---|---|---|
| Bear | 30 % | 42.32 (-23 %) | 35.90 (-28 %) | 36.14 (-23 %) |
| Base | 55 % | 60.31 (+8 %) | 68.49 (+28 %) | 76.12 (+48 %) |
| Bull | 15 % | 72.68 (+29 %) | 85.37 (+57 %) | 99.67 (+88 %) |
| Weighted | 100 % | 56.76 (+2 %) | 61.25 (+16 %) | 67.66 (+33 %) |
What has to go right for Edison, and what could go wrong?
The bear case requires wildfire costs, delayed liability reform and regulatory lag to reinforce one another. Eaton settlements or uninsured losses raise cash needs, debt and interest, while disallowances prevent the capital plan from earning promptly. Investors then apply a lower multiple to weaker earnings.
The bull case requires liability reform, timely recoveries, successful project execution and financing costs that do not worsen. Electrification and large-load growth then reinforce SCE’s investment programme, while a stable or declining share count magnifies per-share gains. SCE projects 30%–40% load growth by 2035 from 2025 levels.
How much cash does Edison really make?
In 2025, Edison generated $5.8 billion from operations and spent $6.515 billion on capital projects, producing negative $715 million of free cash flow. A utility pays for equipment and construction before regulators allow it to recover the investment through customer rates over many years, so negative free cash flow can be normal. It still has to be financed.
| 2025 | 2024 | 2023 | 2022 | 2021 | |
|---|---|---|---|---|---|
| Cash from operations | 5,800 | 5,014 | 3,401 | 3,216 | 11 |
| − Capital spending | 6,515 | 5,707 | 5,448 | 5,778 | 5,505 |
| = Free cash flow | -715 | -693 | -2,047 | -2,562 | -5,494 |
| = Real free cash flow | -772 | -750 | -2,093 | -2,604 | -5,533 |
What this means. Real free cash flow is lower because paying employees with shares gives away part of the company even though no cash leaves.
What does an investor pay for Edison today?
Edison’s trailing P/E was 6.3 times and its next-12-month P/E was 9.1 times. P/E compares the share price with earnings per share, so a low ratio can mean either that the stock is cheap or that earnings are temporarily high. Wildfire recoveries can enlarge reported earnings, reducing the ratio without making the underlying business permanently more profitable.
| Today (Oct 30, 2026) | |
|---|---|
| Share price | 59.38 |
| P/E, last 12 months (calculated) | 6.3x |
| P/E, next 12 months (calculated) | 9.1x |
| Free cash flow yield (calculated) | -3.1% |
| Real free cash flow yield (calculated) | -3.4% |
| Dividend yield (calculated) | 5.9% |