IDEX stock forecast 2027–2029
MyStockButler's October 2026 analysis: The weighted value is $1,397.21 in October 2027. It hinges on whether IDEX converts HST momentum into durable, cash-generating growth without losing the aftermarket or stretching the balance sheet.
Where could IDEX's shares be by 2029?
The weighted value is $1,397.21 in October 2027. That implies a 487% return including dividends from today’s $238.54. By October 2029, weighted value reaches $1,523.35. The return is 543% including dividends. The bear case carries 30% probability. The base case is 50%; the bull case is 20%.
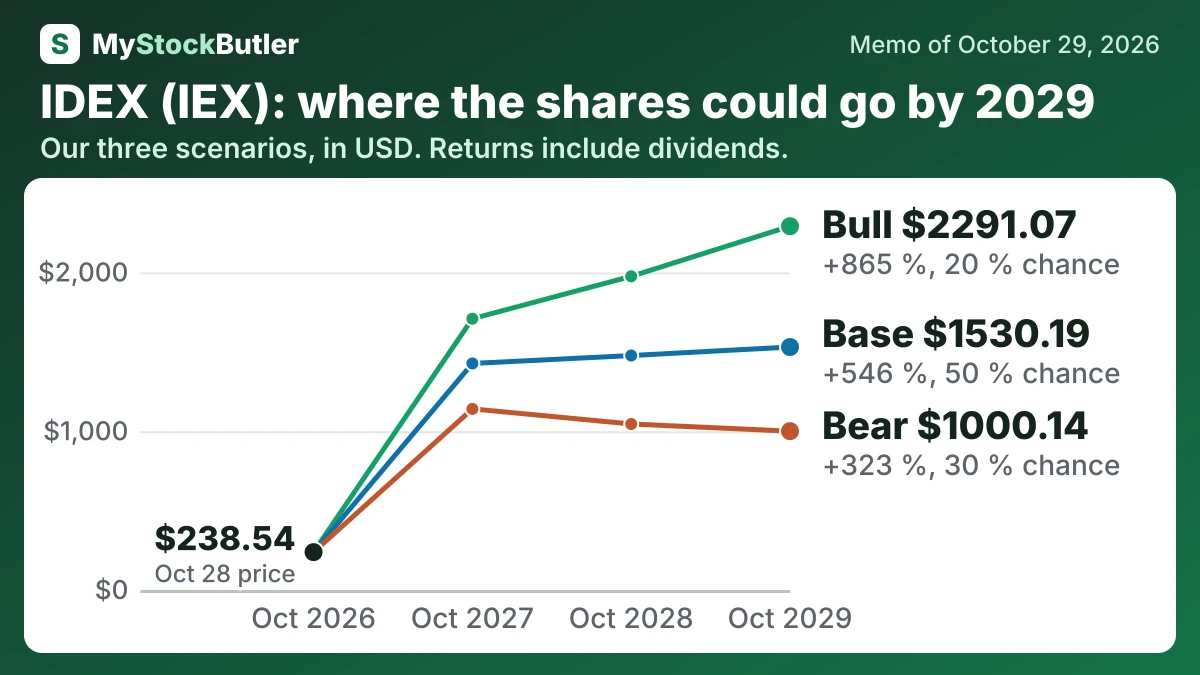
| Case | Probability | October 2027 | October 2028 | October 2029 |
|---|---|---|---|---|
| Bear | 30 % | 1140.43 (+379 %) | 1045.30 (+341 %) | 1000.14 (+323 %) |
| Base | 50 % | 1426.76 (+499 %) | 1476.62 (+522 %) | 1530.19 (+546 %) |
| Bull | 20 % | 1708.50 (+618 %) | 1975.41 (+731 %) | 2291.07 (+865 %) |
| Weighted | 100 % | 1397.21 (+487 %) | 1446.98 (+509 %) | 1523.35 (+543 %) |
What has to go right for IDEX, and what could go wrong?
The investment turns on whether IDEX converts HST momentum into durable, cash-generating growth without losing the aftermarket or stretching the balance sheet.
How much cash does IDEX really make?
Net income measures accounting profit, while free cash flow measures cash generated after capital spending. A sale can count as income before the customer pays, and amortization can reduce profit without using cash in that period. In 2025, IDEX generated $680.4 million from operations and spent $63.6 million on capital equipment, leaving $616.8 million of free cash flow—more than reported net income.
IDEX defines free cash flow as operating cash flow less capital spending. An analyst might subtract the $27.3 million of stock-based compensation as an additional economic cost, producing $589.5 million of “real” free cash flow. That is not a second cash payment; it recognises the possible cost of dilution or share repurchases.
| 2025 | 2024 | 2023 | 2022 | 2021 | |
|---|---|---|---|---|---|
| Cash from operations | 680.4 | 668.1 | 716.7 | 557.4 | 565.3 |
| − Capital spending | 63.6 | 65.1 | 89.9 | 68.0 | 72.7 |
| = Free cash flow | 616.8 | 603.0 | 626.8 | 489.4 | 492.6 |
| − Stock pay | 27.3 | 25.8 | 21.8 | 21.6 | 20.4 |
| = Real free cash flow | 589.5 | 577.2 | 605.0 | 467.8 | 472.2 |
| Real free cash flow, % of revenue | 17.0% | 17.7% | 18.5% | 14.7% | 17.1% |
What this means. The company's own free cash flow matches ours, but our real free cash flow is lower because shares given to employees reduce what is left for shareholders.
What does an investor pay for IDEX today?
IDEX trades at $238.54 per share. That is 33.1x trailing earnings; the next-twelve-month multiple is 24.6x. Free-cash-flow yield is 3.5%, or 3.4% after stock pay. Reported revenue grew 5.8% in 2025, but organic sales grew only 1.0%. Operating margin was 20.2%, below 20.7% in 2024. IDEX’s calculated real free cash flow was 17.0% of revenue in 2025, and real free cash flow per share rose to $7.83 from $7.60.
| Today (Oct 29, 2026) | |
|---|---|
| Share price | 238.54 |
| P/E, last 12 months (calculated) | 33.1x |
| P/E, next 12 months (calculated) | 24.6x |
| Free cash flow yield (calculated) | 3.5% |
| Real free cash flow yield (calculated) | 3.4% |
What this means. The next-12-month price-to-earnings number uses analysts’ forecast profits, so it is an estimate rather than money the company has already earned.