Ingersoll Rand stock forecast 2027–2029
MyStockButler's October 2026 analysis: The weighted scenario puts Ingersoll Rand at $62.46 in October 2027. It hinges on earnings recovery.
Where could Ingersoll Rand's shares be by 2029?
The 32.0x trailing P/E and 19.9x forward P/E make earnings recovery central. The 4.0% free cash flow yield falls to 3.9% after stock-based pay. The 0.1% dividend yield leaves shareholder returns chiefly dependent on reinvestment and buybacks. The weighted price is $62.46 in October 2027, a 19% loss, including dividends. It is $68.04 in October 2029, a 12% loss, including dividends. The forecast assigns 30% probability to the bear case and 50% to base. The bull case receives 20%.
IR’s weighted path stays below today’s price, although the bull case offers substantial upside. The weighted price is $62.46 in October 2027. It rises to $64.92 in October 2028 and $68.04 in October 2029. The total return is negative at each date. It is negative 19% after one year and negative 16% after two. By year three, it is negative 12%, including dividends.
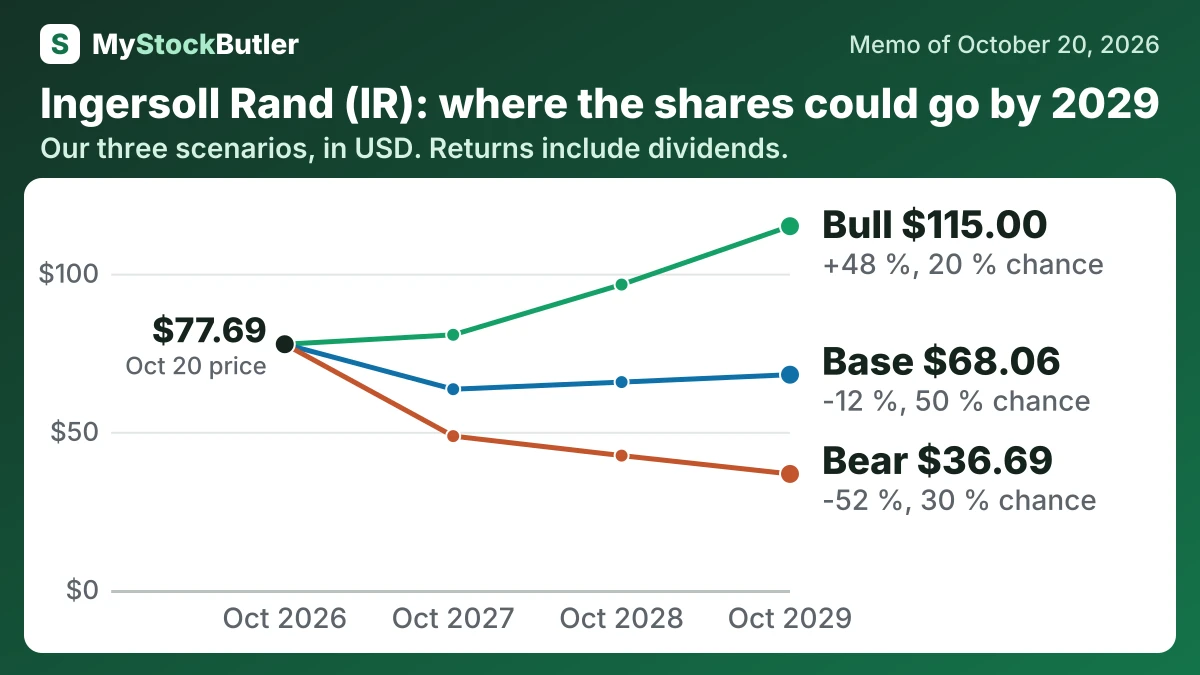
| Case | Probability | October 2027 | October 2028 | October 2029 |
|---|---|---|---|---|
| Bear | 30 % | 48.64 (-37 %) | 42.48 (-45 %) | 36.69 (-52 %) |
| Base | 50 % | 63.47 (-18 %) | 65.72 (-15 %) | 68.06 (-12 %) |
| Bull | 20 % | 80.67 (+4 %) | 96.55 (+24 %) | 115.00 (+48 %) |
| Weighted | 100 % | 62.46 (-19 %) | 64.92 (-16 %) | 68.04 (-12 %) |
What this means. The weighted row is the probability-adjusted average of all three cases, so it can be below the base case because the bear case is more likely than the bull case.
What has to go right or wrong for Ingersoll Rand?
Normal operating profit is the central operating assumption. The base case rises each year as orders, productivity and service attachment improve. The bear case declines as weak investment and China pricing pressure overwhelm service support. The bull case accelerates as delayed orders convert, PST demand compounds and acquisitions add profitable scale.
| October 2027 | October 2028 | October 2029 | |
|---|---|---|---|
| Normal operating profit | 1,296 (1,200 / 1,394) | 1,369 (1,167 / 1,531) | 1,452 (1,134 / 1,683) |
| Shares (millions) | 386 (389 / 382) | 385 (390 / 377) | 384 (390 / 373) |
| Dividends per share | 0.08 (0.08 / 0.08) | 0.08 (0.08 / 0.08) | 0.08 (0.08 / 0.08) |
| Enterprise value to normal operating profit | 21.00 (18.00 / 24.00) | 20.00 (16.00 / 25.00) | 19.00 (14.00 / 26.00) |
| Net debt | 2,690 (2,690 / 2,624) | 2,071 (2,121 / 1,856) | 1,452 (1,552 / 887) |
How much cash does Ingersoll Rand really make?
Stock compensation is another owner cost because employees receive value through shares. Exceptional receipts also need separate treatment: June 2026 free cash flow included a $25.0 million ILC Dover insurance recovery. The best cash measure is the amount that repeats because customers keep buying and paying.
| 2025 | 2024 | 2023 | 2022 | 2021 | |
|---|---|---|---|---|---|
| Cash from operations | 1,355.7 | 1,396.7 | 1,377.4 | 865.4 | 627.8 |
| − Capital spending | 135.6 | 149.1 | 105.4 | 94.6 | 64.1 |
| = Free cash flow | 1,220.1 | 1,247.6 | 1,272.0 | 770.8 | 563.7 |
| − Stock pay | 53.0 | 58.8 | 51.9 | 78.9 | 87.2 |
| = Real free cash flow | 1,167.1 | 1,188.8 | 1,220.1 | 691.9 | 476.5 |
What this means. The company's own free cash flow is higher because it does not subtract shares given to employees as pay, while we count that as a real cost to shareholders.
What does an investor pay for Ingersoll Rand today?
P/E, or price-to-earnings, measures how much investors pay for each dollar of profit. IR’s trailing and forward P/E figures differ sharply, but the comparison works only if the earnings definitions and periods match. Reported profit includes amortization, which spreads the cost of acquired customer relationships and technology across their useful lives. Goodwill impairment and amortization can weaken reported earnings without causing an equal fall in current cash, but they can also reveal that an acquisition was worth less than expected.