IDEX earnings date
MyStockButler's October 2026 analysis: IDEX's next results are expected on February 3, 2027. The key thing to watch is whether orders become shipments and growth broadens beyond HST.
What has IDEX guided for the current plan?
IDEX can reach $1,523.35 by October 2029 if HST growth converts into repeat, profitable sales and broader demand supports cash flow. Management’s October 28, 2026 outlook calls for organic sales growth of 6.5%–6.8% and adjusted EPS of $8.91–$8.96. It also guides to $110 million of capital expenditures and 100.0% free-cash-flow conversion.
| Period guided | Low | High | Date it was given | |
|---|---|---|---|---|
| Organic Sales Growth y/y | Year to Dec 2026 | 6.5% | 6.8% | Oct 28, 2026 |
| Adjusted EPS | Year to Dec 2026 | 8.91 | 8.96 | Oct 28, 2026 |
| Adjusted EBITDA Margin | Year to Dec 2026 | 27.1% | 27.3% | Oct 28, 2026 |
| Capital Expenditures | Year to Dec 2026 | 110 | 110 | Oct 28, 2026 |
| FCF Conversion | Year to Dec 2026 | 100.0% | Oct 28, 2026 | |
| Net Interest Expense | Year to Dec 2026 | 62 | 62 | Oct 28, 2026 |
Has IDEX kept its past promises?
The 2025 forecast record was mixed. Management initially expected organic sales growth of 1%–3% and adjusted earnings of $8.10–$8.45 per diluted share. Organic growth finished at approximately 1%, but adjusted earnings finished at $7.95 after the outlook was reduced during the year.
| What management forecast | Checked | Above | Within | Below |
|---|---|---|---|---|
| Organic sales growth | 5 years | 2 | 1 | 2 |
| Adjusted diluted EPS | 5 years | 2 | 0 | 3 |
| GAAP diluted EPS | 4 years | 1 | 1 | 2 |
What is IDEX's revenue and profit trend?
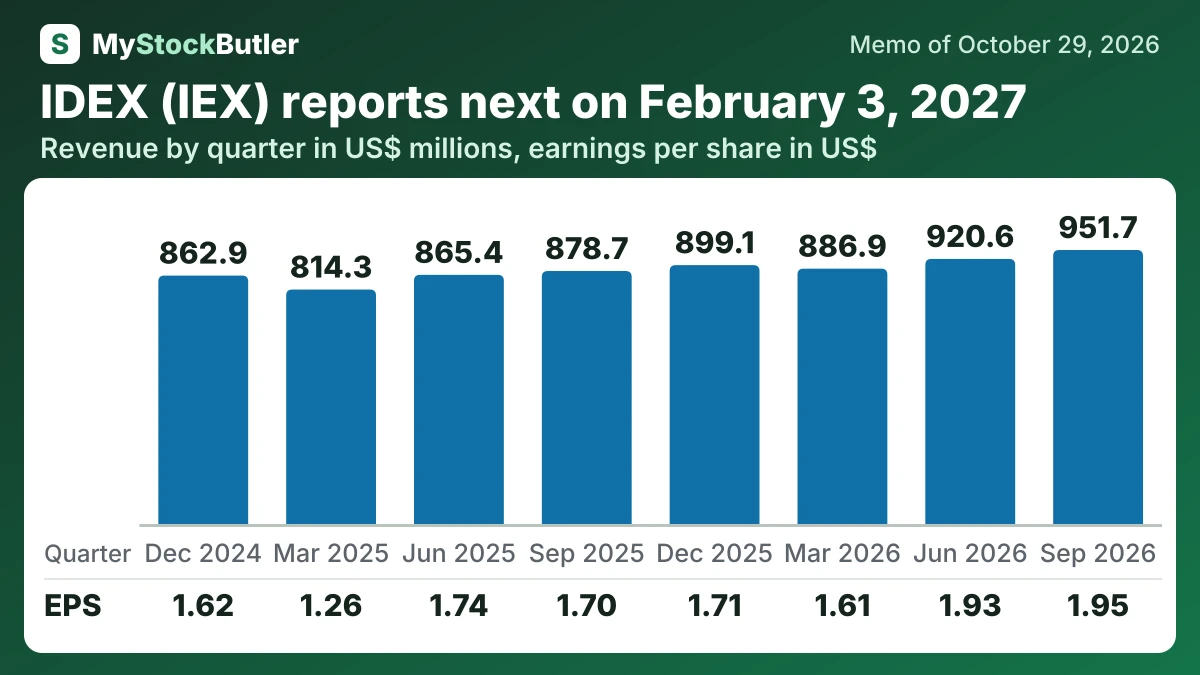
Revenue rose from $878.7 million in the September 2025 quarter to $951.7 million in the September 2026 quarter. Diluted EPS rose from $1.70 to $1.95, while gross margin improved from 44.5% to 45.1%. Free cash flow also increased from $188.7 million to $214.3 million. Because organic growth was driven mainly by volume, this recovery looks stronger than the earlier price-led improvement.
| Sep 2026 | Jun 2026 | Mar 2026 | Dec 2025 | Sep 2025 | Jun 2025 | Mar 2025 | Dec 2024 | |
|---|---|---|---|---|---|---|---|---|
| Revenue | 951.7 | 920.6 | 886.9 | 899.1 | 878.7 | 865.4 | 814.3 | 862.9 |
| Gross margin | 45.1% | 46.4% | 44.9% | 43.1% | 44.5% | 45.3% | 45.3% | 42.5% |
| Operating income | 208.0 | 199.9 | 172.4 | 183.6 | 185.8 | 187.9 | 142.0 | 165.3 |
| Net income | 144.1 | 143.4 | 120.0 | 128.3 | 127.8 | 131.6 | 95.5 | 123.2 |
| EPS, diluted | 1.95 | 1.93 | 1.61 | 1.71 | 1.70 | 1.74 | 1.26 | 1.62 |
| = Free cash flow | 214.3 | 177.0 | 86.0 | 189.8 | 188.7 | 146.9 | 91.4 | 157.1 |
What this means. The cash flow numbers for the quarters ending December 2025 and December 2024 are calculated by subtracting the first nine months from the full year, rather than being reported for just those three months.
What should I watch in IDEX's next results?
The report will show whether IDEX met its raised 2026 target, whether third-quarter orders became shipments and whether margins held after planned shutdowns. Orders are customer commitments; sales are recorded when products are delivered and accounting conditions are met. A data-center order can therefore improve future visibility without appearing immediately as revenue, and orders can arrive in large, uneven batches.
The 2027 outlook deserves more attention than its headline number. HST will compare against a strong 2026, so repeating the same percentage growth will become harder. Investors should look for life sciences and the broader industrial businesses to join data centers, semiconductors, space and defense, rather than leaving growth dependent on a few hot applications.