FIS dividend
MyStockButler's October 2026 analysis: FIS paid $1.44 per share in 2024, down from $2.08; its 2025 real free cash flow per share was $2.74. FIS paid out $1.06 per share more than free cash flow in 2025, so the dividend was not fully covered by that measure.
How much does FIS pay in dividends?
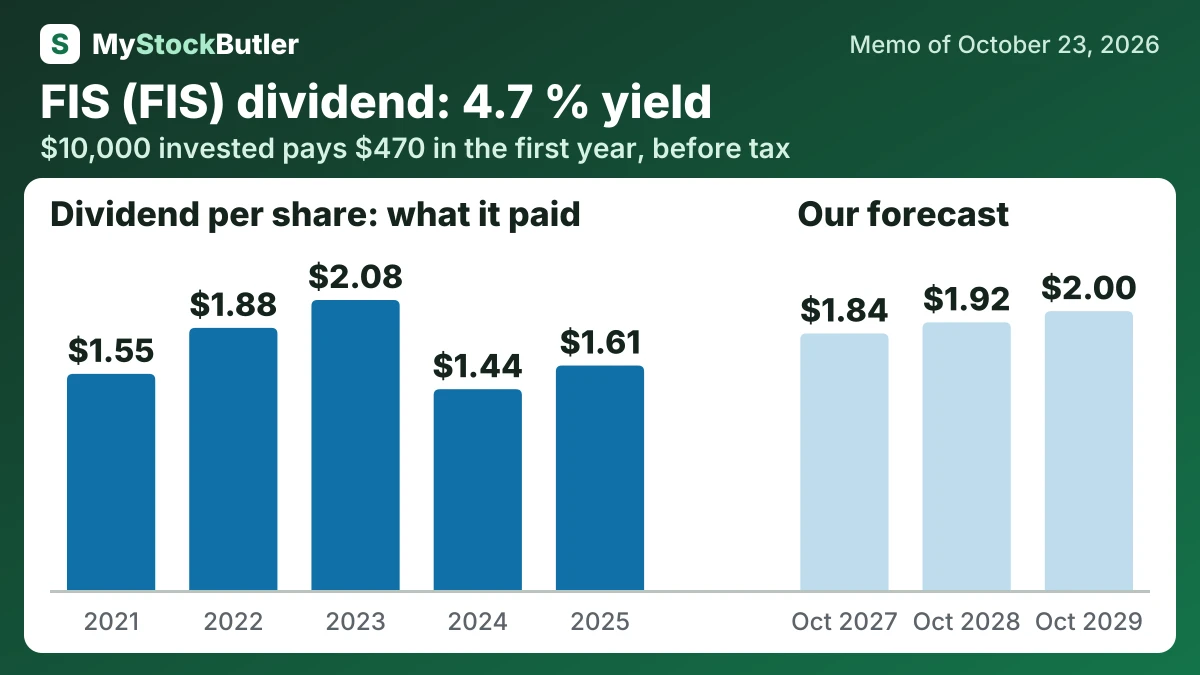
The dividend reflects restraint. The base moves from $1.84 to $2.00 per share, near the company's stated adjusted-EPS-linked growth aim. The bear falls from $1.76 to $1.40 because debt and interest pressure force cuts. The bull rises from $1.88 to $2.20 as cash conversion improves. The 2024 reduction from $2.08 to $1.44 shows that the payout is not untouchable.
| 2025 | 2024 | 2023 | 2022 | 2021 | |
|---|---|---|---|---|---|
| Revenue | 10,677 | 10,127 | 9,831 | 9,720 | 9,339 |
| Net income | 382 | 787 | 502 | 576 | 320 |
| EPS, diluted | 0.73 | 1.42 | 0.85 | 0.95 | 0.52 |
| Dividend per share | 1.60 | 1.44 | 2.08 | 1.88 | 1.56 |
How much would FIS's dividend pay you?
$10,000 invested in FIS at its 4.7% dividend yield (our report of October 23, 2026) pays $470.00 in the first year, before tax. If its dividend per share keeps changing 1.0% a year, as it did from 2021 to 2025, and the dividends are reinvested, year 10 pays $786.26, with $6,145.10 received in all.
Before tax. Past dividend growth is not a promise. Information only, not investment advice.
Does FIS’s cash cover its dividend?
Revenue growth reached 5.4% in 2025 while operating margin was 16.3%. FIS’s real free cash flow, computed as cash from operations minus capital spending and stock pay, recovered to a 13.5% margin in 2025 from 4.5% in 2022. Net debt reached $20,430 million by June 2026 from $12,483 million at year-end 2025. Diluted EPS was $0.73 while real free cash flow per share was $2.74. FIS paid out $1.06 per share more than free cash flow in 2025; average diluted share count fell 5.4% as buybacks reduced shares.
| 2025 | 2024 | 2023 | 2022 | 2021 | |
|---|---|---|---|---|---|
| Free cash flow | 1,619 | 1,358 | 1,298 | 626 | 1,353 |
| − Dividends paid | 847 | 800 | 1,231 | 1,138 | 961 |
| − Share buybacks | 1,328 | 3,970 | 500 | 1,829 | 1,994 |
| = Paid out more than the free cash flow | 558 | 3,417 | 442 | 2,351 | 1,611 |
What this means. The company paid shareholders more cash than it generated from the business, so it had to use savings or borrow money to cover the difference.
What could change FIS’s dividend?
The base case would gain support if organic growth tracks the reduced 4.5%–5.0% outlook and integration approaches the end-2027 target. The bull case would become credible if migrations, retention and cross-sales lift growth, savings expand margins, and cash approaches the 2028 target.
| October 2027 | October 2028 | October 2029 | |
|---|---|---|---|
| Free cash flow after stock pay | 1,550 (1,250 / 1,850) | 1,800 (1,000 / 2,350) | 2,050 (1,150 / 2,800) |
| Shares (millions) | 511 (518 / 504) | 502 (521 / 488) | 492 (524 / 471) |
| Dividends per share | 1.84 (1.76 / 1.88) | 1.92 (1.60 / 2.04) | 2.00 (1.40 / 2.20) |
| Net debt | 20,020 (20,093 / 19,928) | 19,585 (19,926 / 19,272) | 19,119 (19,509 / 18,408) |