FIS stock forecast 2027–2029
MyStockButler's October 2026 analysis: FIS’s weighted path reaches $63.36 by October 2029, an 84% gain including dividends. FIS’s outcome hinges on integration, client retention, and cash generation.
Where could FIS's shares be by October 2029?
The weighted path starts at $31.04 in October 2027, a 12% loss including dividends. It ends at $63.36 in October 2029, an 84% gain including dividends. The bear case carries 30% probability. The base case carries 52%. The bull case carries 18%.
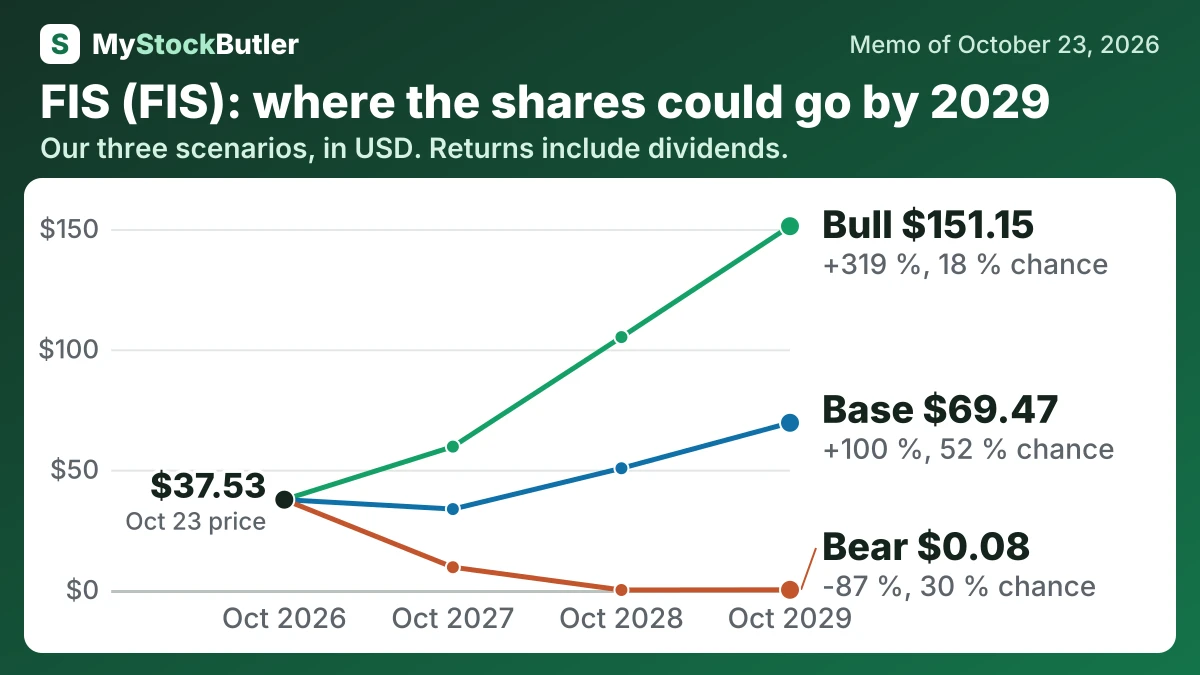
| Case | Probability | October 2027 | October 2028 | October 2029 |
|---|---|---|---|---|
| Bear | 30 % | 9.46 (-70 %) | 0.00 (-91 %) | 0.08 (-87 %) |
| Base | 52 % | 33.62 (-6 %) | 50.58 (+45 %) | 69.47 (+100 %) |
| Bull | 18 % | 59.57 (+64 %) | 105.08 (+190 %) | 151.15 (+319 %) |
| Weighted | 100 % | 31.04 (-12 %) | 45.22 (+30 %) | 63.36 (+84 %) |
What has to go right or wrong for FIS?
The decisive drivers are integration, client retention, and cash generation. On November 4, 2026, third-quarter results should show whether acquired clients, activity, and revenue are holding up. Through end-2027, migrations, savings, cross-sold contracts, and substantial TSYS integration are the operating tests. TSYS is FIS’s card-processing business. In 2028, the test is whether FIS approaches its more-than-$3-billion free-cash-flow ambition and directs cash to debt reduction.
Cash generation is the main swing factor. Six-month data left $690 million before stock pay, while strict annual cash flow reached $1,438 million in 2025 after falling to $437 million in 2022. The base case starts at $1,550 million in 2027 and reaches $2,050 million by 2029, allowing integration and savings to improve cash. The bear case falls from $1,250 million to $1,000 million before recovering to $1,150 million. The bull case rises from $1,850 million to $2,800 million as retention, cross-sales and migrations succeed.
How much cash does FIS really make?
Revenue growth reached 5.4% in 2025 while operating margin was 16.3%. FIS’s real free cash flow, computed as cash from operations minus capital spending and stock pay, recovered to a 13.5% margin in 2025 from 4.5% in 2022. Net debt reached $20,430 million by June 2026 from $12,483 million at year-end 2025. Diluted EPS was $0.73 while real free cash flow per share was $2.74. FIS paid out $1.06 per share more than free cash flow in 2025; average diluted share count fell 5.4% as buybacks reduced shares.
Software development adds another complication. Payroll and contractor costs can be capitalized first and expensed through amortization later. Cash flow records that investment earlier than accounting profit does. Deducting stock compensation also gives a stricter owner-cost measure because shares issued to employees dilute existing owners.
| 2025 | 2024 | 2023 | 2022 | 2021 | |
|---|---|---|---|---|---|
| Cash from operations | 2,608 | 2,175 | 2,078 | 1,622 | 2,271 |
| − Capital spending | 989 | 817 | 780 | 996 | 918 |
| = Free cash flow | 1,619 | 1,358 | 1,298 | 626 | 1,353 |
| − Stock pay | 181 | 186 | 120 | 189 | |
| = Real free cash flow | 1,438 | 1,172 | 1,178 | 437 | |
| Real free cash flow, % of revenue | 13.5% | 11.6% | 12.0% | 4.5% |
What does an investor pay for FIS today?
| Today (Oct 23, 2026) | |
|---|---|
| Share price | 37.53 |
| P/E, last 12 months (calculated) | 5.8x |
| P/E, next 12 months (calculated) | 6.1x |
| Price to book (calculated) | 1.2x |
| Free cash flow yield (calculated) | 8.4% |
| Real free cash flow yield (calculated) | 7.4% |
What this means. The free cash flow yields look lower because today's company value includes the newly acquired business, but the cash flow figure does not yet include it.