Broadridge stock forecast 2027–2029
MyStockButler's October 2026 analysis: Broadridge’s weighted forecast reaches $243.86 in October 2029, with 25% probability to the bear case, 55% to the base case and 20% to the bull case. It hinges on recurring growth converting into durable cash, implementation staying on track and capital allocation supporting earnings.
Where could Broadridge’s shares be by October 2029?
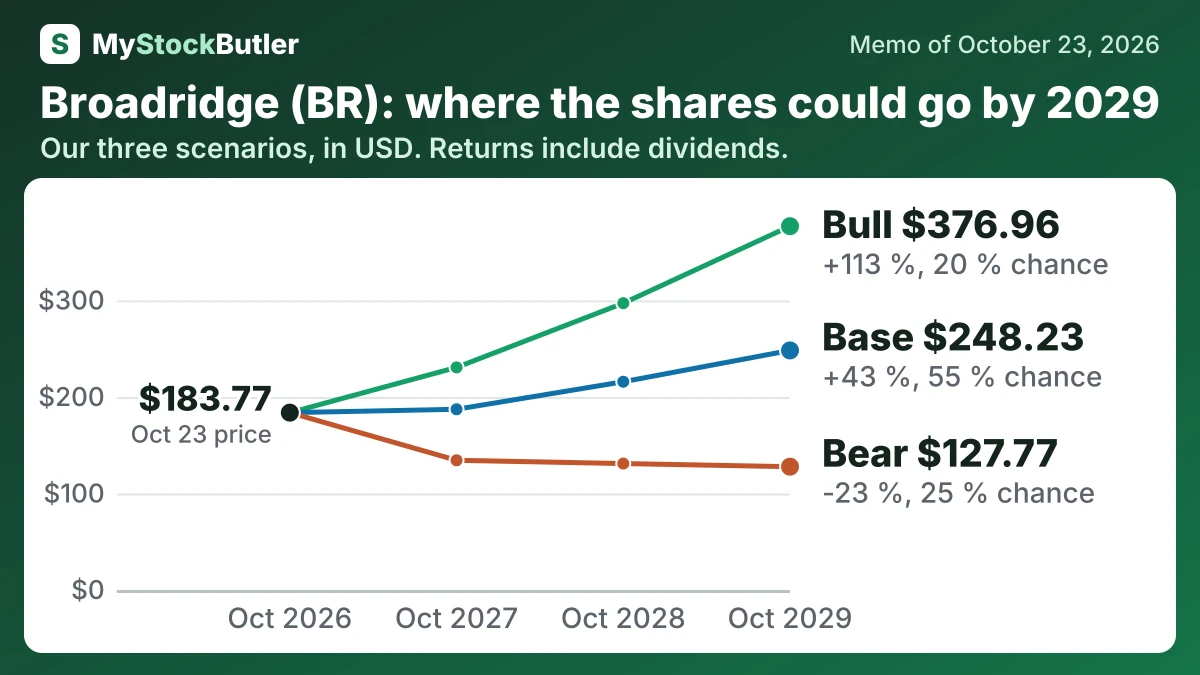
The weighted price is $182.72 in October 2027, a 2% total return including dividends, and $243.86 in October 2029, a 40% total return. The forecast assigns 25% probability to the bear case, 55% to the base case and 20% to the bull case.
| Case | Probability | October 2027 | October 2028 | October 2029 |
|---|---|---|---|---|
| Bear | 25 % | 134.39 (-24 %) | 131.00 (-24 %) | 127.77 (-23 %) |
| Base | 55 % | 187.26 (+4 %) | 215.81 (+22 %) | 248.23 (+43 %) |
| Bull | 20 % | 230.66 (+28 %) | 297.18 (+67 %) | 376.96 (+113 %) |
| Weighted | 100 % | 182.72 (+2 %) | 210.88 (+20 %) | 243.86 (+40 %) |
What this means. The weighted row is the probability-based average of the bear, base, and bull cases, not a guaranteed share price.
What has to go right for Broadridge, and what could go wrong?
The bear case uses revenue growth of 5%, 5% and 6%, with margins of 14.8%, 14.5% and 14.5%. The bull case uses growth of 9%, 10% and 10%, with margins of 15.4%, 16.0% and 16.5%. These differences reflect implementation delays and postage pressure in the bear case, versus faster backlog conversion and AI productivity in the bull case.
How much cash does Broadridge really make?
Operating cash flow records money collected and paid during the year. Free cash flow starts there and subtracts capital spending, so it measures what remains after maintaining and expanding physical capacity. Broadridge’s cash generation has improved faster than revenue, although working-capital timing affects the comparison.
Broadridge’s own free-cash-flow measure also subtracts software purchases and capitalized internal-use software. That is important because software is part of the productive investment in this business. An analyst may go further and subtract stock compensation: it is not a cash payment that year, but it transfers value to employees and can dilute existing shareholders.
| Jun 2026 | Jun 2025 | Jun 2024 | Jun 2023 | Jun 2022 | |
|---|---|---|---|---|---|
| Cash from operations | 1,345.6 | 1,171.3 | 1,056.2 | 823.3 | 443.5 |
| − Capital spending | 67.2 | 43.8 | 57.4 | 38.4 | 29.0 |
| = Free cash flow | 1,278.4 | 1,127.5 | 998.8 | 784.9 | 414.5 |
| − Stock pay | 93.9 | 73.4 | 70.6 | 73.1 | 68.4 |
| = Real free cash flow | 1,184.5 | 1,054.1 | 928.2 | 711.8 | 346.1 |
| Real free cash flow, % of revenue | 15.8% | 15.3% | 14.3% | 11.7% | 6.1% |
What this means. The company's own free cash flow is lower because it subtracts software spending that our count leaves out, while our real free cash flow also subtracts shares given to employees as pay.
What does an investor pay for Broadridge today?
Trailing P/E measures the price paid for each dollar of last-12-month earnings. FY26 GAAP earnings included a $227 million Canton digital-asset gain that did not come from selling client services. Broadridge removed that gain from adjusted EPS while adding back acquired-intangible amortization, acquisition and integration costs, and restructuring; the offsets left GAAP and adjusted EPS equal. That coincidence says little about ordinary earnings quality.
| Today (Oct 23, 2026) | |
|---|---|
| Share price | 183.77 |
| Market value (calculated) | 20,747.6 |
| Enterprise value (calculated) | 23,599.3 |
| P/E, last 12 months (calculated) | 19.1x |
| Free cash flow yield (calculated) | 6.2% |
| Real free cash flow yield (calculated) | 5.7% |
What this means. Enterprise value is higher than market value because it adds the company's debt and subtracts its cash, showing what it would cost to buy the whole business.