Fiserv stock forecast 2027–2029
MyStockButler's October 2026 analysis: Fiserv’s weighted forecast reaches $63.80 by October 2027 (+32%). It hinges on implementation recovery, better service and durable Clover monetization.
Where could Fiserv’s shares be by 2029?
Fiserv can move materially higher if implementation recovery, better service and durable Clover monetization restore earnings credibility. The weighted forecast reaches $63.80 by October 2027 (+32%) and $117.02 by October 2029 (+142%). The scenario probabilities are bear 35%, base 50% and bull 15%.
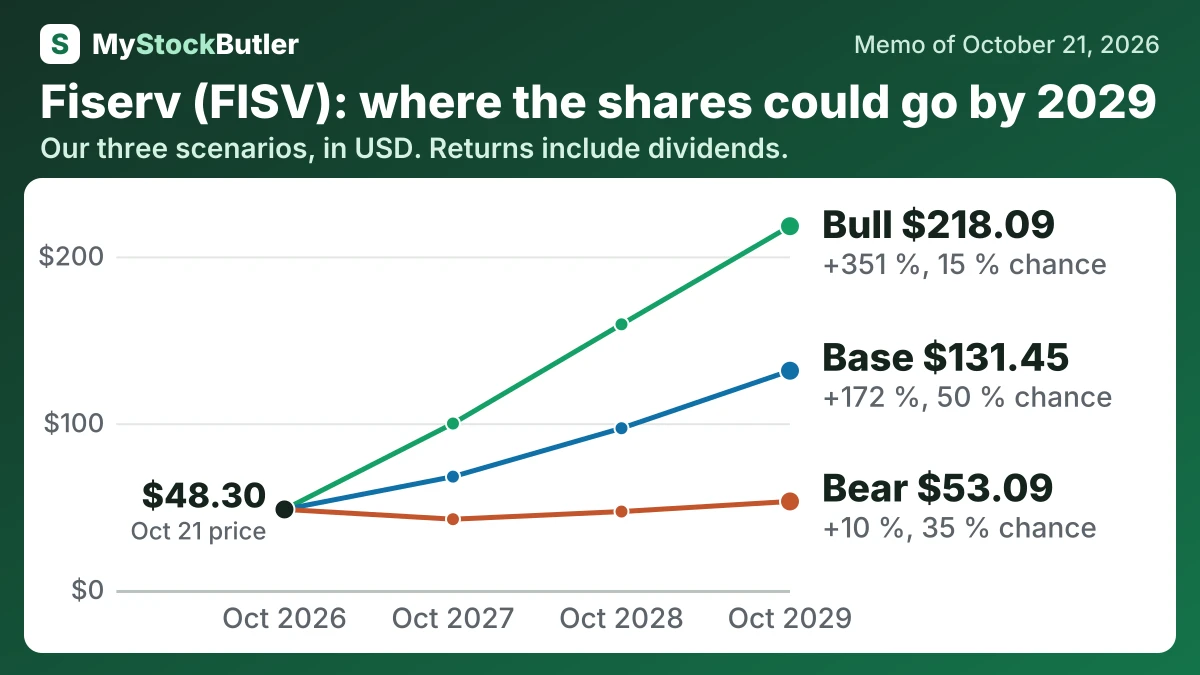
| Case | Probability | October 2027 | October 2028 | October 2029 |
|---|---|---|---|---|
| Bear | 35 % | 42.44 (-12 %) | 47.02 (-3 %) | 53.09 (+10 %) |
| Base | 50 % | 67.96 (+41 %) | 96.97 (+101 %) | 131.45 (+172 %) |
| Bull | 15 % | 99.80 (+107 %) | 159.26 (+230 %) | 218.09 (+351 %) |
| Weighted | 100 % | 63.80 (+32 %) | 88.83 (+84 %) | 117.02 (+142 %) |
What this means. The weighted row is the average value after giving each case the importance of its probability.
What has to go right or wrong for Fiserv?
The view would move toward the bear case if customer implementations and bank conversions slip through 2027–2028, or if technology and support costs keep margins under pressure. Payment volume that fails to convert into retained revenue would also weaken the 2027–2029 earnings path.
The view would move toward the bull case if delayed contracts begin contributing during 2027–2028, service reliability improves, and Clover’s volume is accompanied by stronger paid-services revenue. By 2028–2029, sustained margin recovery and earnings credibility would justify the higher multiple.
How much cash does Fiserv really make?
Fiserv’s own free-cash-flow measure was $4,435 million in 2025. It adds back some severance, integration and transformation payments, although those payments left the bank account. Stock compensation creates a second economic cost: employees receive shares instead of cash, transferring value to them. Deducting $357 million of stock pay gives analytical real free cash flow of $3,942 million.
| 2025 | 2024 | 2023 | 2022 | 2021 | |
|---|---|---|---|---|---|
| Cash from operations | 6,062 | 6,631 | 5,162 | 4,618 | 4,034 |
| − Capital spending | 1,763 | 1,569 | 1,388 | 1,479 | 1,160 |
| = Free cash flow | 4,299 | 5,062 | 3,774 | 3,139 | 2,874 |
| − Stock pay | 357 | 367 | 342 | 323 | 239 |
| = Real free cash flow | 3,942 | 4,695 | 3,432 | 2,816 | 2,635 |
| Real free cash flow, % of revenue | 18.6% | 23.0% | 18.0% | 15.9% | 16.2% |
What this means. The company's own free cash flow is higher because it leaves out some cash payments and adjustments that our count includes.
What does an investor pay for Fiserv today?
The forward multiple implies approximately $7.92 of earnings per share. That is arithmetic, not a promise. The denominator might use GAAP or adjusted earnings, a calendar year or the next twelve months. Management’s latest adjusted-EPS guidance for 2026 is $7.20–$7.40, so the definitions and periods need to be reconciled.
| Today (Oct 21, 2026) | |
|---|---|
| Share price | 48.31 |
| P/E, last 12 months (calculated) | 9.3x |
| P/E, next 12 months (calculated) | 6.1x |
| Free cash flow yield (calculated) | 16.7% |
| Real free cash flow yield (calculated) | 15.3% |
What this means. The next-year price-to-earnings ratio uses analysts’ guesses about future profit, so it is not based on money the company has already earned.