Essex earnings date and guidance
MyStockButler's October 2026 analysis: Essex's next results are expected on February 3, 2027. For Essex, watch whether same-property revenue becomes NOI and cash after expenses.
What has Essex guided for 2026?
Management’s latest forecast, issued October 27, calls for Core FFO of $16.10–$16.22 per diluted share for 2026, with a midpoint of $16.16. Net income is the ordinary accounting result. FFO adjusts it because depreciation treats an apartment building as wearing out, while Core FFO removes other items Essex considers outside normal operations. Neither measure is cash in the bank.
| Period guided | Low | High | Date given | |
|---|---|---|---|---|
| FFO per share - diluted | Year to Dec 2026 | 15.42 | 15.54 | Oct 27, 2026 |
| Core FFO per share - diluted | Year to Dec 2026 | 16.10 | 16.22 | Oct 27, 2026 |
| Same-Property Revenue | Year to Dec 2026 | 2.8% | 3.0% | Oct 27, 2026 |
| Same-Property NOI | Year to Dec 2026 | 2.8% | 3.2% | Oct 27, 2026 |
What this means. Some expenses show the higher scenario with a smaller number because the company lists expenses as positive amounts, so lower spending is better.
Did Essex keep its past promises?
The company also raised its outlook after that quarter. Across five years and three measures, all 15 results met or exceeded the original annual ranges, and 10 exceeded their tops. That record supports confidence in management’s caution, but it does not guarantee that the latest, higher forecast will be beaten.
| What management forecast | Checked | Above | Within | Below |
|---|---|---|---|---|
| Core FFO per diluted share | 5 years | 4 | 1 | 0 |
| Same-Property Revenues growth, cash basis | 5 years | 3 | 2 | 0 |
| Same-Property Net Operating Income growth, cash basis | 5 years | 3 | 2 | 0 |
What this means. The company beat its forecast for core funds from operations per diluted share in four of five years and met it in the other year.
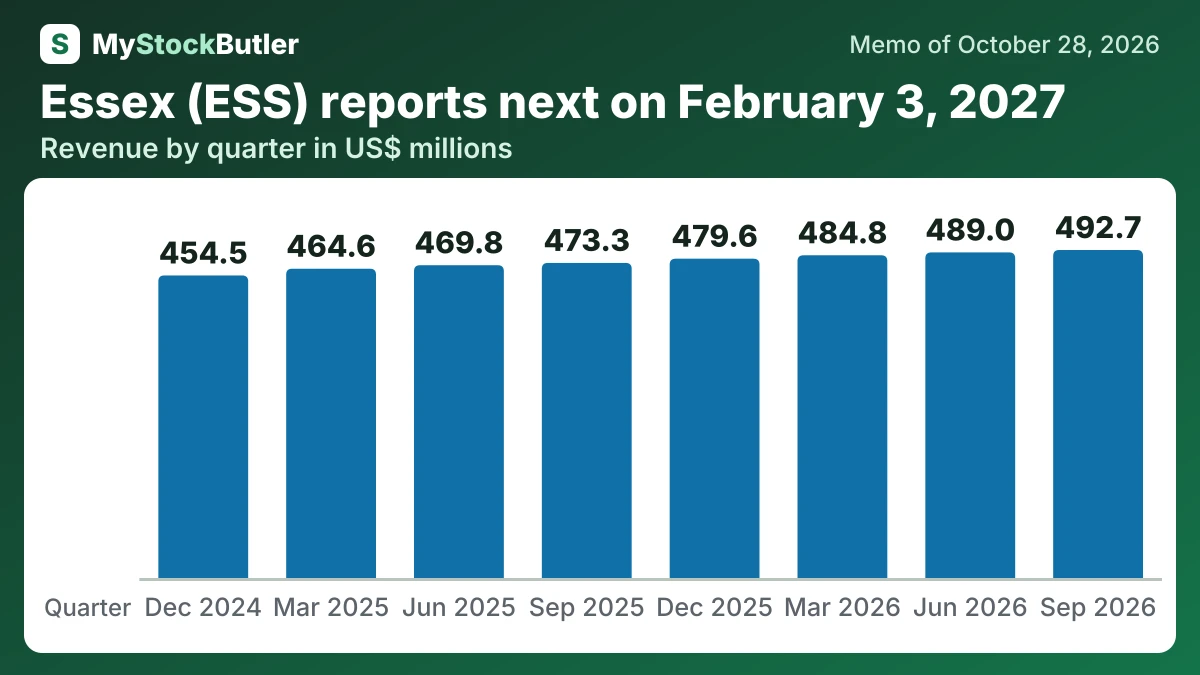
What has Essex's revenue and profit done over the last eight quarters?
NOI rose overall, while same-property NOI growth swung from contraction to a sharp 2022 increase before moderating. Occupancy stayed steady, making regional rent growth and expense control the operating test. Leverage, the use of borrowed money compared with overall financial resources, improved from 2021, then rose again in 2025. FFO—property earnings that add back building depreciation and exclude property-sale gains or losses—was nearly flat per share in 2024 and 2025 while the dividend rose. Core FFO’s payout stayed below two-thirds, but diluted shares increased slightly in 2025 and repurchases provided no current return support.
| Sep 2026 | Jun 2026 | Mar 2026 | Dec 2025 | Sep 2025 | Jun 2025 | Mar 2025 | Dec 2024 | |
|---|---|---|---|---|---|---|---|---|
| Revenue | 492,690 | 489,049 | 484,756 | 479,626 | 473,303 | 469,833 | 464,583 | 454,469 |
| Net operating income | 340,850 | 345,709 | 341,187 | 335,823 | 327,506 | 332,181 | 323,468 | 318,341 |
| FFO per share | 3.98 | 3.32 | 4.17 | 3.94 | 4.03 | 4.03 | 3.97 | 3.69 |
| Core FFO per share (company's measure) | 4.00 | 4.08 | 4.06 | 3.98 | 3.97 | 4.03 | 3.97 | 3.92 |
| Dividend per share | 2.59 | 2.59 | 2.59 | 2.57 | 2.57 | 2.57 | 2.57 | 2.45 |
| Occupancy | 96.3% | 96.3% | 96.5% | 96.4% | 96.0% | 96.2% | 96.3% | 95.9% |
What this means. The company's own adjusted profit per share is not the same as our standard funds from operations per share because its adjustments may leave out regular spending needed to maintain the properties.
What should you watch in Essex's next results?
The fourth-quarter and full-year 2026 results should show whether same-property revenue becomes NOI and cash. Investors should watch expenses alongside rents, because taxes, insurance, utilities and repairs can absorb growth. Regional averages also deserve attention: management has described Northern California as stronger than Southern California, so the portfolio total may hide uneven performance.