WTW dividend: payments and cash coverage
MyStockButler's October 2026 analysis: WTW’s forecast dividend rises from $3.87 in 2027 to $4.26 in 2029. WTW generated $1,546 million of free cash flow in 2025 and $1,393 million of real free cash flow after stock-based pay.
How much does WTW pay per share?
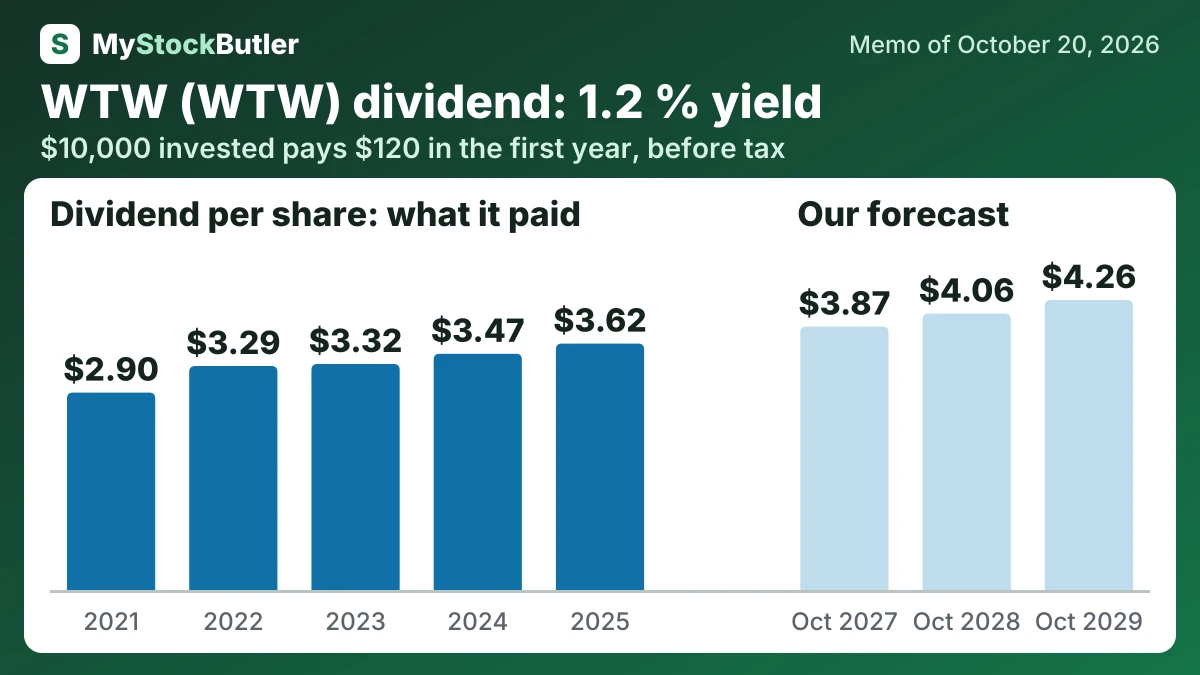
Dividends grow at roughly the recent pace in the base case. The base row rises from $3.87 in 2027 to $4.06 in 2028 and $4.26 in 2029. The bear pauses at $3.87 after 2027, while the bull reaches $4.18 in 2028 and $4.51 in 2029. The base reflects 5.1% five-year dividend growth and $1,546 million of 2025 free cash flow.
| 2025 | 2024 | 2023 | 2022 | 2021 | |
|---|---|---|---|---|---|
| Free cash flow per share | 15.62 | 12.57 | |||
| − Dividends paid, per share | 3.62 | 3.47 | 3.32 | 3.29 | 2.90 |
| = FCF not paid out, per share | 0.14 | ||||
| = Paid out more than FCF, per share | 4.76 |
What this means. The company's own free cash flow per share is the same as ours here, but the more cautious real figure is lower because it subtracts the value of shares given to employees as pay.
How much would WTW's dividend pay you?
$10,000 invested in WTW at its 1.2% dividend yield (our report of October 20, 2026) pays $120.00 in the first year, before tax. If its dividend per share keeps changing 5.7% a year, as it did from 2021 to 2025, and the dividends are reinvested, year 10 pays $226.24, with $1,673.43 received in all.
Before tax. Past dividend growth is not a promise. Information only, not investment advice.
Is WTW’s dividend covered by its cash?
Free cash flow subtracts capital spending from operating cash. WTW spent $229 million on capital assets and software in 2025, leaving $1,546 million of free cash flow. Its free-cash-flow margin was 15.9%, compared with 14.0% in 2024.
Using adjusted net income, free-cash-flow conversion was 91.7%. Using adjusted operating income, it was 63.1%, because operating income comes before interest and tax. After allowing for $153 million of share-based compensation, analytical “real free cash flow” was $1,393 million. That is an allowance for employee compensation and dilution, not a deduction made in WTW’s cash-flow statement.
| 2025 | 2024 | 2023 | 2022 | 2021 | |
|---|---|---|---|---|---|
| Free cash flow | 1,546 | 1,282 | |||
| − Dividends paid | 358 | 354 | 352 | 369 | 374 |
| − Share buybacks | 1,650 | 901 | 1,000 | 3,530 | 1,627 |
| = Free cash flow not paid out | 14 | ||||
| Paid out, % of free cash flow | 129.9% | 97.9% |
What this means. The company paid shareholders more cash than it generated, so it had to use savings or new borrowing to cover the difference.
What could change WTW’s dividend?
| October 2027 | October 2028 | October 2029 | |
|---|---|---|---|
| Earnings | 1,884 (1,737 / 1,993) | 2,075 (1,720 / 2,290) | 2,247 (1,712 / 2,597) |
| Shares (millions) | 90.83 (92.20 / 89.49) | 89.06 (91.42 / 86.54) | 87.53 (90.50 / 83.95) |
| Dividends per share | 3.87 (3.87 / 3.87) | 4.06 (3.87 / 4.18) | 4.26 (3.87 / 4.51) |
| Price to earnings | 16.00 (14.00 / 18.00) | 16.50 (13.00 / 19.00) | 17.00 (12.00 / 20.00) |
What is WTW’s dividend yield today?
At $318.72 a share on October 20, 2026, shareholders’ equity is valued at $29,600.14 million, while enterprise value is $34,469.14 million. Enterprise value includes the operating business before separating shareholders’ and lenders’ claims, so the two measures are not interchangeable.