Brown & Brown stock forecast 2027–2029
MyStockButler's October 2026 analysis: Brown & Brown's weighted scenario is $91.12 in October 2027. It hinges on Accession savings, improving organic growth, and debt staying under control.
Where could Brown & Brown's shares be by 2029?
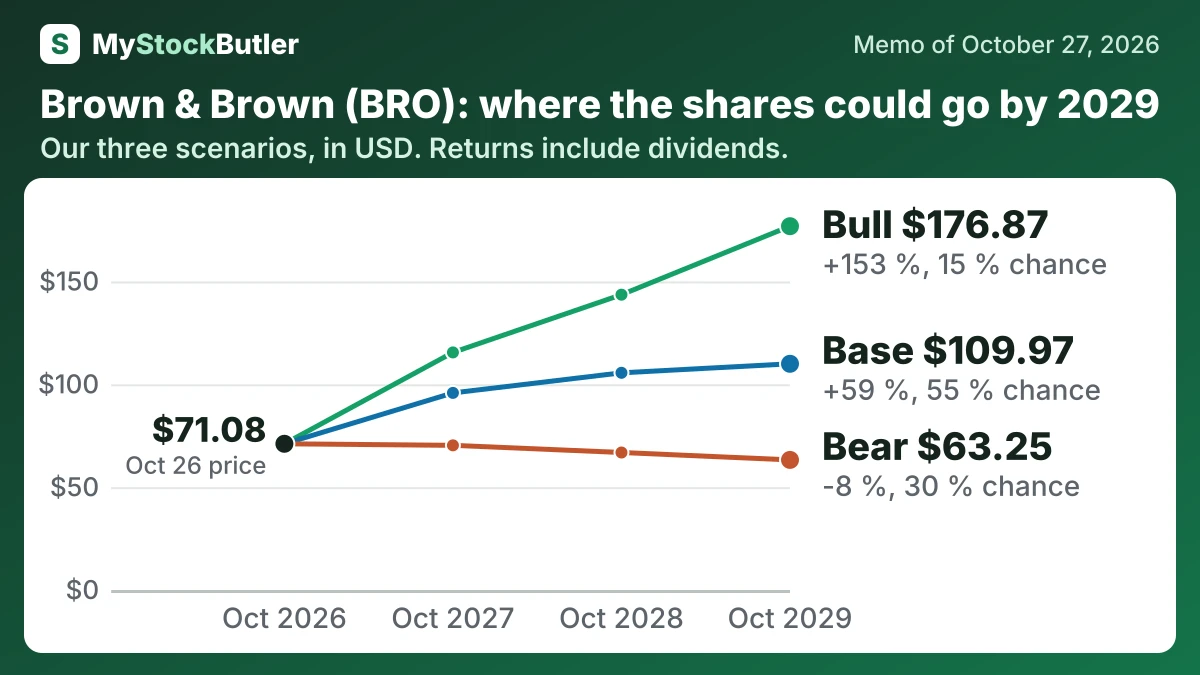
The forecast points to meaningful upside, but the outcome depends heavily on execution. The probability-weighted share price is $91.12 in October 2027, which represents a 29% return from today’s $71.08 after including dividends. It rises to $99.66 in October 2028 and $105.99 in October 2029, for a 53% return including dividends.
| Case | Probability | October 2027 | October 2028 | October 2029 |
|---|---|---|---|---|
| Bear | 30 % | 70.33 (-0 %) | 66.84 (-4 %) | 63.25 (-8 %) |
| Base | 55 % | 95.82 (+36 %) | 105.59 (+51 %) | 109.97 (+59 %) |
| Bull | 15 % | 115.50 (+64 %) | 143.57 (+105 %) | 176.87 (+153 %) |
| Weighted | 100 % | 91.12 (+29 %) | 99.66 (+43 %) | 105.99 (+53 %) |
What this means. The weighted row is the estimated average value after giving each case more or less influence according to its probability.
What has to go right or wrong for Brown & Brown?
This recovery assumes integration costs fade and Accession savings build toward the $175 million annual run rate targeted by the end of 2028. It still retains recurring amortization, interest and tax, and excludes one-time gains and acquisition costs. The bear case holds earnings near $1,284 million by 2029 because weak pricing, client losses and debt keep margins falling from 18.0% to 17.0%. The bull case reaches $2,036 million as strong retention, new business and savings lift margins to 23.0%. The recent evidence supports caution: nine-month organic growth was only 0.3%, while net income remained positive through the five-year record.
How much cash does Brown & Brown really make?
Stock compensation needs separate treatment. It is added back to operating cash flow because it does not immediately use cash, but it gives employees additional claims on the company. A specialist subtracts it when estimating cash that truly belongs to existing shareholders.
| 2025 | 2024 | 2023 | 2022 | 2021 | |
|---|---|---|---|---|---|
| Cash from operations | 1,450 | 1,174 | 1,010 | 881 | 808.8 |
| − Capital spending | 68 | 82 | 69 | 52 | 45.0 |
| = Free cash flow | 1,382 | 1,092 | 941 | 829 | 763.8 |
| − Stock pay | 93 | 101 | 89 | 66 | 61.0 |
| = Real free cash flow | 1,289 | 991 | 852 | 763 | 702.8 |
What this means. The company's free cash flow is higher than our real free cash flow because its count does not subtract shares given to employees as pay, which reduces each shareholder's ownership.
What does an investor pay for Brown & Brown today?
At the current price, a trailing P/E of 22.5x implies about $3.16 of earnings per share, while a forward P/E of 15.8x implies about $4.50. If both figures use identical definitions, the forecast implies roughly 42% earnings growth. If the first uses reported earnings and the second uses adjusted earnings, part of that apparent improvement comes from changing the measurement rather than improving the business.
| Today (Oct 27, 2026) | |
|---|---|
| Share price | 71.08 |
| P/E, last 12 months (calculated) | 22.5x |
| P/E, next 12 months (calculated) | 15.8x |
| Free cash flow yield (calculated) | 5.9% |
| Real free cash flow yield (calculated) | 5.5% |
What this means. The market value includes shares held in an acquisition escrow, but the book value leaves those shares out, so the two figures use different share counts.