Verisk earnings
MyStockButler's October 2026 analysis: The next Verisk results are expected on November 5, 2026. Watch whether Synergy Studio migrations produce more usage or renewal value.
What has Verisk guided for 2026?
For 2026, management guides to revenue of $3,190–$3,240 million and adjusted EBITDA of $1,790–$1,830 million. Adjusted EPS guidance is $7.45–$7.75. For 2026–2028, it targets 6%–8% annual organic constant-currency revenue growth. Its adjusted EBITDA target is 7%–10%. Management plans to return at least 75% of free cash flow through dividends and buybacks.
| Period guided | Low | High | Date given | |
|---|---|---|---|---|
| Total revenue | Year to Dec 2026 | 3,190 | 3,240 | Jul 29, 2026 |
| Adjusted EBITDA | Year to Dec 2026 | 1,790 | 1,830 | Jul 29, 2026 |
| Adjusted EBITDA margin | Year to Dec 2026 | 56.0% | 56.5% | Jul 29, 2026 |
| Diluted adjusted EPS | Year to Dec 2026 | 7.45 | 7.75 | Jul 29, 2026 |
| Capital expenditures | Year to Dec 2026 | 260 | 280 | Jul 29, 2026 |
| Dividend per share | Year to Dec 2026 | 2.00 | 2.00 | Jul 29, 2026 |
What this means. These numbers are the company’s forecasts for 2026, shown as a range from its low estimate to its high estimate, not results it has already achieved.
Did Verisk keep its past promises?
Management also promised annual organic constant-currency revenue growth of 6%–8% and adjusted EBITDA growth of 7%–10%. For 2023–2025, it reported compound annual growth of 7.5% and 10.0%. That supports credibility, though it does not settle whether every award was deserved.
| What management forecast | Checked | Above | Within | Below |
|---|---|---|---|---|
| Capital expenditures | 5 years | 0 | 2 | 3 |
| Fixed asset depreciation & amortization | 5 years | 1 | 3 | 1 |
| Intangible amortization | 5 years | 3 | 0 | 2 |
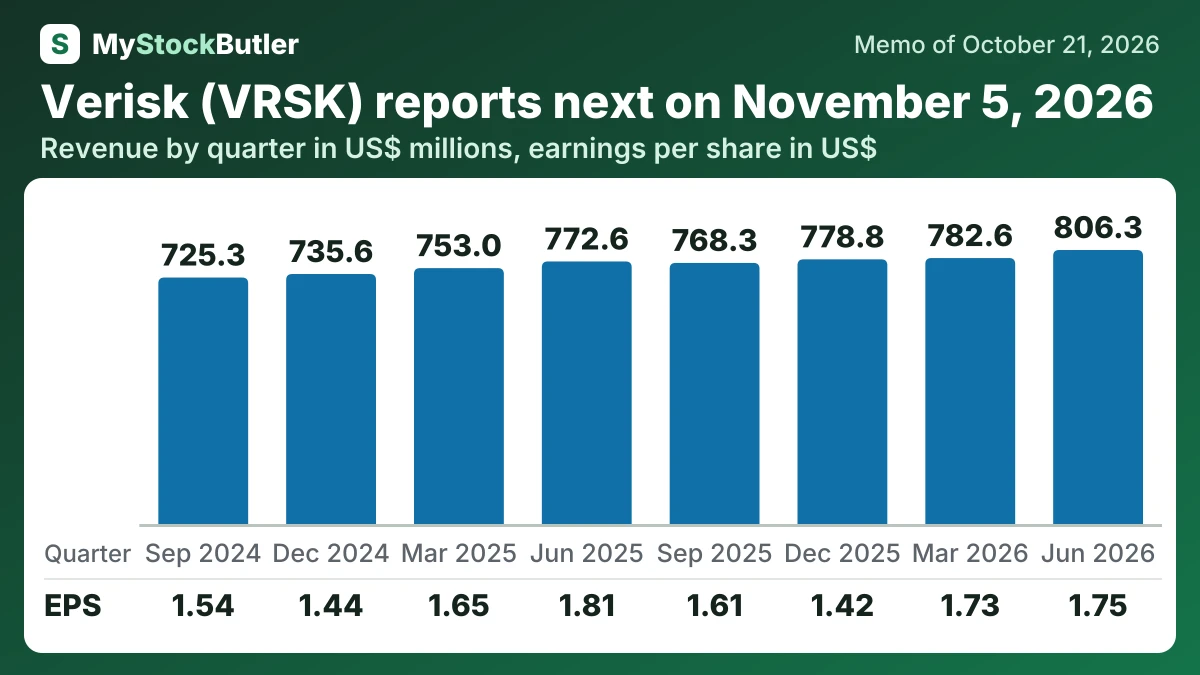
What do Verisk's last eight quarters show?
June 2026 showed a partial operating recovery, but higher costs prevented it from reaching reported earnings.
| Jun 2026 | Mar 2026 | Dec 2025 | Sep 2025 | Jun 2025 | Mar 2025 | Dec 2024 | Sep 2024 | |
|---|---|---|---|---|---|---|---|---|
| Revenue | 806.3 | 782.6 | 778.8 | 768.3 | 772.6 | 753.0 | 735.6 | 725.3 |
| Gross margin | 71.1% | 69.8% | 69.7% | 70.1% | 70.3% | 69.3% | 68.7% | 69.2% |
| Operating income | 363.7 | 352.2 | 313.6 | 345.9 | 354.3 | 330.1 | 316.3 | 311.5 |
| Income from continuing operations attributable to Verisk | 228.6 | 234.2 | 197.2 | 225.5 | 253.3 | 232.3 | 203.6 | 220.1 |
| EPS, diluted | 1.75 | 1.73 | 1.42 | 1.61 | 1.81 | 1.65 | 1.44 | 1.54 |
| = Free cash flow | 297.9 | 326.4 | 276.1 | 336.1 | 188.7 | 391.0 | 200.0 | 240.7 |
What this means. These are quarterly numbers, so each amount covers about three months rather than a full year.
What should investors watch in Verisk's next results?
Verisk is scheduled to report third-quarter results on November 5, 2026. Investors should look first for evidence that Synergy Studio migrations are progressing. They should then look for commercial proof: more hosting, additional products, higher renewal pricing, or stronger usage.
AccuLynx is the larger discontinuity. Verisk agreed to buy the business for $2.35 billion in cash in 2025. After Verisk tried to terminate the agreement, Delaware’s Court of Chancery ruled against it on August 7, 2026, and Verisk appealed on August 18. Specific performance means a court requires a party to carry out a contract rather than merely pay damages. Because the original financing was unwound, an adverse appeal could force Verisk to arrange new borrowing or reduce buybacks and other returns.