Ulta earnings date and guidance
MyStockButler's October 2026 analysis: Ulta's next results are expected on December 3, 2026. The key thing to watch is whether sales, earnings and cash generation support the raised plan.
What has Ulta guided for fiscal 2026?
Fiscal 2026 guidance called for net sales growth of 6.7%–7.2% and comparable sales growth of 3.2%–3.7%. Operating income growth was forecast at 8.3%–9.3%, with diluted EPS of $28.70–$29.00. Capital expenditure was $400 million–$450 million and stock repurchases were $1.8 billion.
| Period guided | Low | High | Date given | |
|---|---|---|---|---|
| Net sales growth | Fiscal 2026 (year to Jan 2027) | 6.7% | 7.2% | Aug 27, 2026 |
| Comparable sales growth | Fiscal 2026 (year to Jan 2027) | 3.2% | 3.7% | Aug 27, 2026 |
| Operating income growth | Fiscal 2026 (year to Jan 2027) | 8.3% | 9.3% | Aug 27, 2026 |
| Diluted earnings per share | Fiscal 2026 (year to Jan 2027) | 28.70 | 29.00 | Aug 27, 2026 |
| Capital expenditures | Fiscal 2026 (year to Jan 2027) | 400,000 | 450,000 | Aug 27, 2026 |
| capital to shareholders through its stock repurchase program | Fiscal 2026 (year to Jan 2027) | 1,800,000 | 1,800,000 | Aug 27, 2026 |
What this means. The 1.8 billion dollars for stock repurchases is money the company plans to spend buying back its own shares, not money it has already paid to shareholders.
Has Ulta kept its past promises?
Management’s forecasting record supports moderate confidence. Ulta met or beat 16 of 20 initial forecasts across five years and four annual measures, although the record includes pandemic-recovery comparisons and the Space NK acquisition. Fiscal 2024 showed the risk more clearly: weaker traffic, heavier promotions and higher expenses reduced profitability.
| What management forecast | Checked | Above | Within | Below |
|---|---|---|---|---|
| Net sales | 5 years | 4 | 0 | 1 |
| Comparable sales | 5 years | 4 | 0 | 1 |
| Operating margin | 5 years | 3 | 1 | 1 |
| Diluted earnings per share | 5 years | 4 | 0 | 1 |
What this means. Operating margin here is the average of each year's margin, not the total profit from five years divided by total sales from five years.
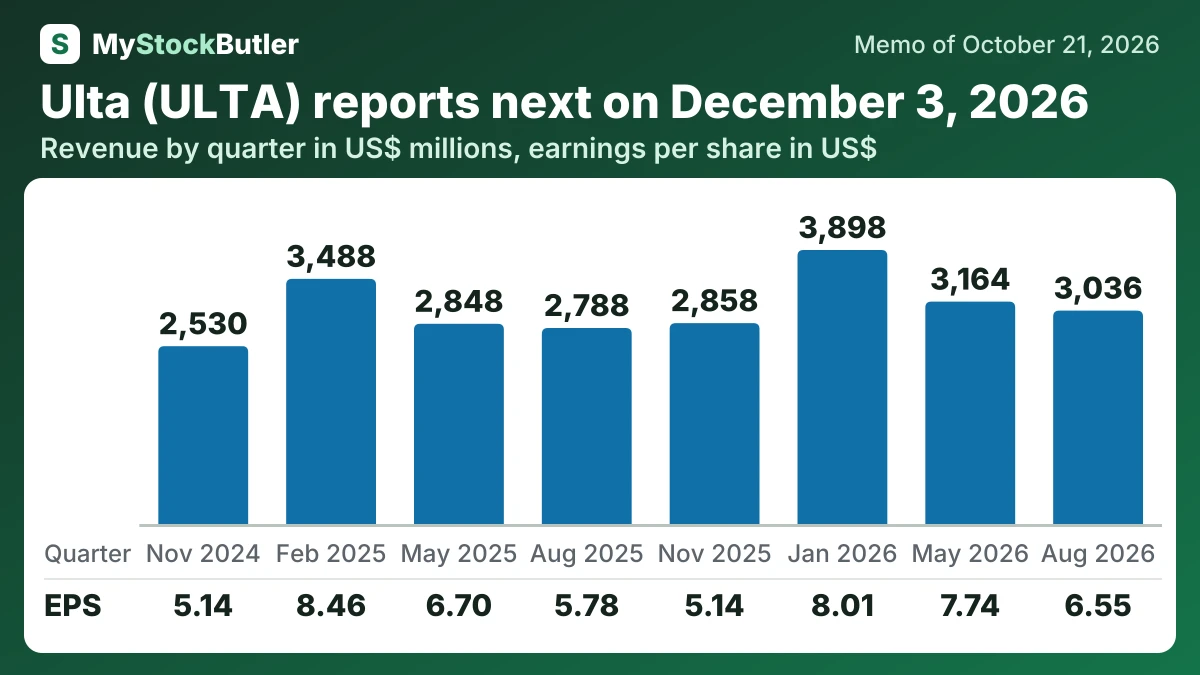
How have Ulta's revenue and profit changed over the last eight quarters?
Revenue reached 3,035,676, up 8.9% from the prior year. Operating income rose 10.1% to 379,641. Net income rose 8.1% to 282,006, while diluted EPS grew 13.3% to $6.55. The faster EPS growth again reflects the effect of fewer shares.
| Aug 2026 | May 2026 | Jan 2026 | Nov 2025 | Aug 2025 | May 2025 | Feb 2025 | Nov 2024 | |
|---|---|---|---|---|---|---|---|---|
| Revenue | 3,035,676 | 3,163,857 | 3,898,361 | 2,857,623 | 2,788,469 | 2,848,367 | 3,487,619 | 2,530,100 |
| Gross margin | 39.1% | 40.1% | 38.1% | 40.4% | 39.2% | 39.1% | 38.2% | 39.7% |
| Operating income | 379,641 | 448,256 | 476,942 | 309,419 | 344,854 | 401,777 | 516,321 | 318,502 |
| Net income | 282,006 | 340,469 | 356,677 | 230,875 | 260,875 | 305,052 | 393,270 | 242,179 |
| EPS, diluted | 6.55 | 7.74 | 8.01 | 5.14 | 5.78 | 6.70 | 8.46 | 5.14 |
| = Free cash flow | 38,438 | 203,618 | 989,029 | -81,633 | 19,565 | 140,990 | 962,642 | -171,073 |
What this means. Free cash flow can be negative even when net income is positive because it subtracts money spent on equipment and buildings.
What should I watch in Ulta's next results?
The next scheduled test is the Q3 fiscal 2026 earnings call on December 3, 2026. Compare EPS with the analyst hurdle of $5.63, then examine whether management changes its annual guidance. A beat matters more if management also remains confident about the rest of the year.
Finally, watch inventory, operating cash, capital expenditure and buybacks together. The fiscal year ending in January 2027 is the final test. Ulta may meet EPS guidance through fewer shares, but the stronger result would be growth that also replenishes cash and reduces debt.