Ulta stock forecast 2027–2029
MyStockButler's October 2026 analysis: The weighted path is $610.96 by October 2027 and $762.98 by October 2029. It hinges on transactions broadening beyond ticket growth.
Where could Ulta's shares be by October 2029?
At October 2029, outcomes run from $390.00 in the bear case to $1,263.01 in the bull case. The bear probability is 25%, while the base probability is 55%. The bull probability is 20%, reflecting a demanding but plausible upside path.
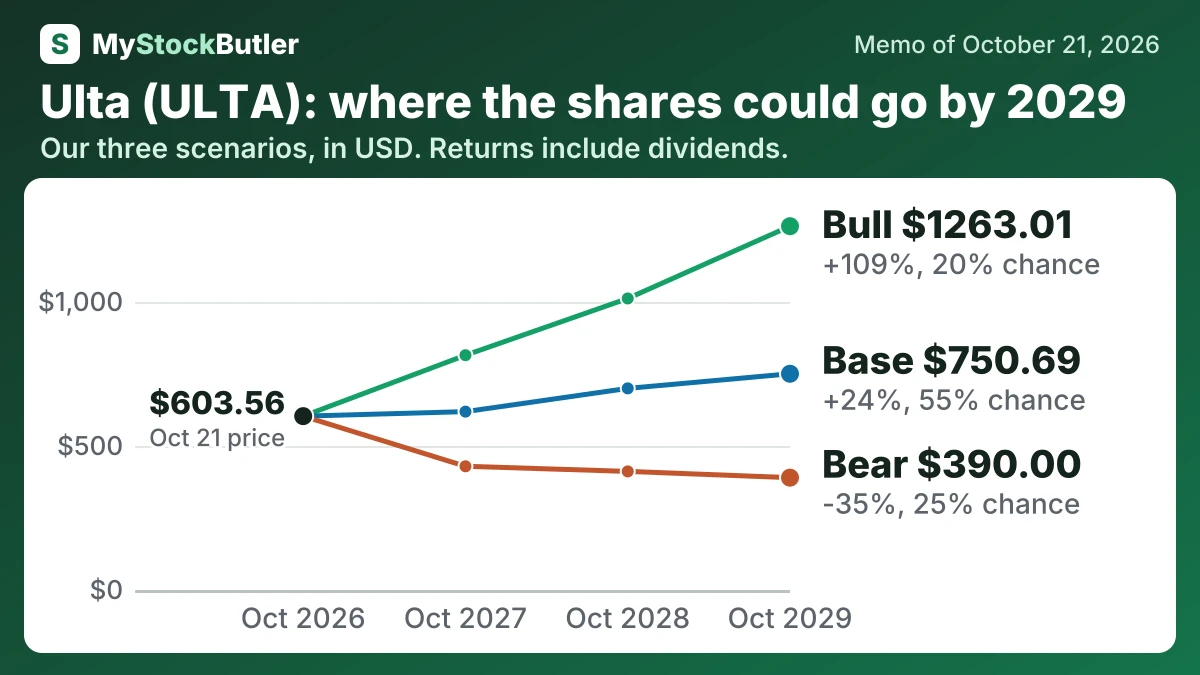
| Case | Probability | October 2027 | October 2028 | October 2029 |
|---|---|---|---|---|
| Bear | 25% | 429.48 (-29%) | 411.71 (-32%) | 390.00 (-35%) |
| Base | 55% | 619.24 (+3%) | 700.00 (+16%) | 750.69 (+24%) |
| Bull | 20% | 815.06 (+35%) | 1012.12 (+68%) | 1263.01 (+109%) |
| Weighted | 100% | 610.96 (+1%) | 690.35 (+14%) | 762.98 (+26%) |
What this means. The weighted row is the probability-based average of the bear, base, and bull cases, not a separate forecast.
What has to go right or wrong for Ulta?
That recovery broadly follows management's 4%–6% sales framework while staying below the historical margin peak. The latest quarter gives some support: comparable sales rose 3.8%, but the gain came mainly from a 3.9% higher average ticket while transactions were roughly flat. The bear case therefore reduces earnings from $1,174 million to $1,122 million as revenue stalls and margins contract. The bull case lifts earnings from $1,418 million to $1,748 million as broader transactions, better inventory and lower shrink improve margins.
How much cash does Ulta really make?
That cash yield has weakened over time. Free cash flow fell from 11.5% of revenue in January 2023 to 8.6% in January 2026. Subtracting stock pay produces “real free cash flow” of 1,030,525, or 8.3% of revenue. Stock compensation is not a current cash payment, but it transfers ownership to employees, so the deduction makes an economic cost visible.
| Jan 2026 | Feb 2025 | Feb 2024 | Jan 2023 | Jan 2022 | |
|---|---|---|---|---|---|
| Cash from operations | 1,502,780 | 1,338,605 | 1,476,266 | 1,481,915 | 1,059,265 |
| − Capital spending | 434,829 | 374,458 | 435,267 | 312,126 | 172,187 |
| = Free cash flow | 1,067,951 | 964,147 | 1,040,999 | 1,169,789 | 887,078 |
| − Stock pay | 37,426 | 42,787 | 48,246 | 43,044 | 47,259 |
| = Real free cash flow | 1,030,525 | 921,360 | 992,753 | 1,126,745 | 839,819 |
What this means. Stock pay does not use cash today, but we subtract it because giving employees shares gives away part of what belongs to shareholders.
What does an investor pay for Ulta today?
On October 21, 2026, one share cost $603.56. Its trailing P/E was 22.0x, meaning investors paid $22 for each dollar Ulta earned per share over the previous twelve months. Its forward P/E was 18.8x, using estimated earnings for the next twelve months. The lower multiple is not automatically a bargain: it assumes the larger future earnings arrive. At that price and multiple, the arithmetic implies forward EPS of about $32.10.
| Today (Oct 21, 2026) | |
|---|---|
| Share price | 603.56 |
| P/E, last 12 months (calculated) | 22.0x |
| P/E, next 12 months (calculated) | 18.8x |
| Free cash flow yield (calculated) | 4.1% |
| Real free cash flow yield (calculated) | 4.0% |
What this means. The next 12 months price-to-earnings number uses analysts’ forecast profits, so it is an estimate rather than a measure of what the company has already earned.