T. Rowe Price dividend
MyStockButler's October 2026 analysis: T. Rowe Price pays a regular dividend of $1.30 per share quarterly, or $5.20 annually at the current rate. Its cash coverage is mixed: dividends, buybacks and payments to minority owners exceeded free cash flow from 2023 through 2025, though T. Rowe Price ended 2025 with more net cash and less debt.
How much does T. Rowe Price pay shareholders over time?
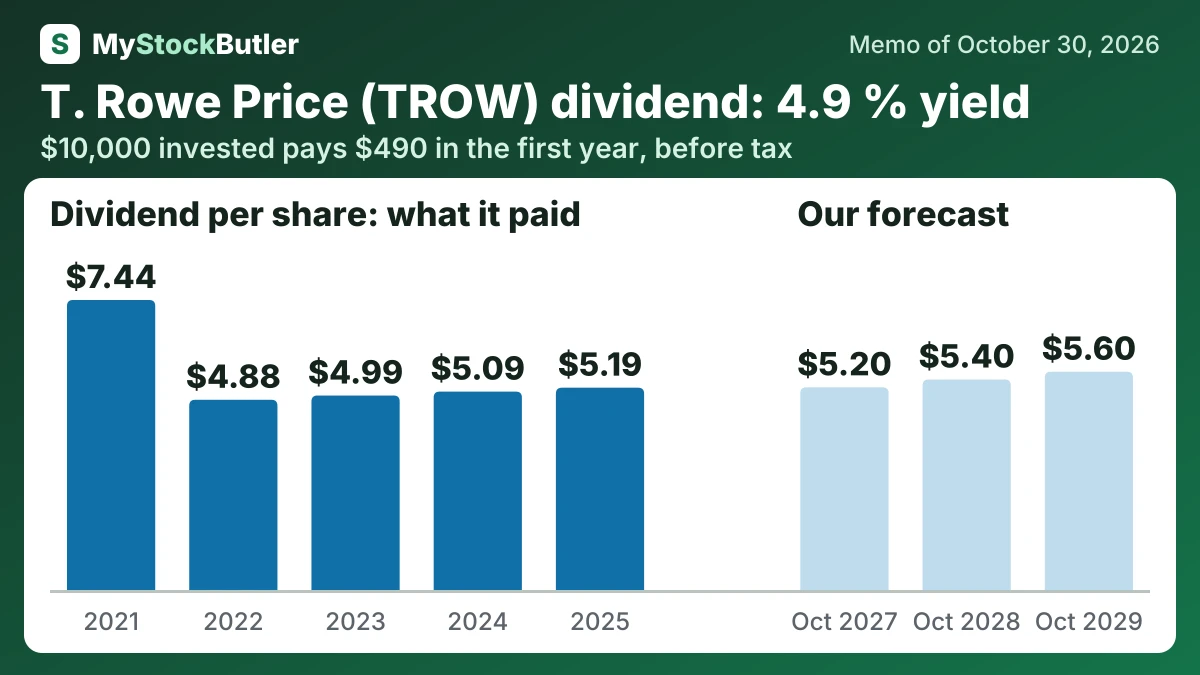
The regular dividend increased to $1.30 per share in February 2026. Through September 2026, the company had paid $500.9 million for repurchases, although it made no new repurchase trades in the third quarter. Management described buybacks as opportunistic, so year-to-date cash payments do not show that the authorization has ended.
| 2025 | 2024 | 2023 | 2022 | 2021 | |
|---|---|---|---|---|---|
| Dividend per share | 5.08 | 4.96 | 4.88 | 4.80 | 7.32 |
What this means. The 2021 dividend per share excludes a one-time extra three-dollar dividend, so it is lower than the total paid that year.
How much would T. Rowe Price's dividend pay you?
$10,000 invested in T. Rowe Price at its 4.9% dividend yield (our report of October 30, 2026) pays $490.00 in the first year, before tax. If its dividend per share keeps changing −8.6% a year, as it did from 2021 to 2025, and the dividends are reinvested, year 10 pays $297.20, with $3,935.74 received in all.
Before tax. Past dividend growth is not a promise. Information only, not investment advice.
Is T. Rowe Price’s dividend covered by its cash?
The table shows that acquisitions, principally OHA, used cash in 2021, while investment sales and maturities released capital that had previously been invested. Those sales create cash, but they are not new management-fee income. From 2023 through 2025, dividends, buybacks, and payments to minority owners exceeded free cash flow each year, with investment sales helping cover the difference.
T. Rowe Price nevertheless ended 2025 with more net cash and less debt than it had at the end of 2021. That cushion made generous distributions possible, but repeated reliance on asset sales would be less reassuring than funding them from recurring fees.
| 2025 | 2024 | 2023 | 2022 | 2021 | |
|---|---|---|---|---|---|
| Free cash flow | 1,479.2 | 1,262.2 | 911.2 | 2,121.8 | 3,212.9 |
| − Dividends paid | 1,143.0 | 1,135.6 | 1,121.7 | 1,107.4 | 1,701.9 |
| − Share buybacks | 620.9 | 337.2 | 254.4 | 849.8 | 1,138.5 |
| = Free cash flow not paid out | 129.5 | 372.5 | |||
| = Net cash | 3,356.4 | 2,590.7 | 1,977.2 | 1,652.6 | 1,409.6 |
| Paid to shareholders | 1,763.9 | 1,472.8 | 1,376.1 | 1,957.2 | 2,840.4 |
What this means. The company paid shareholders more than the cash it generated in 2025, 2024, and 2023, so it used savings or new borrowing to cover the difference.
What could change T. Rowe Price’s dividend?
The dividend begins at $5.20 per share, reflecting the current $1.30 quarterly rate. The base case increases it gradually to $5.60, consistent with annual dividend growth through the supplied history. The bear case cuts it to $4.16 after the first year if earnings and cash weaken; the bull case reaches $6.00 as new products improve cash capacity. Substantial net cash and past free cash flow support the base, but payouts already exceeded free cash flow in three recent years.
| October 2027 | October 2028 | October 2029 | |
|---|---|---|---|
| Dividends per share | 5.20 (5.20 / 5.20) | 5.40 (4.16 / 5.60) | 5.60 (4.16 / 6.00) |
| Net debt | -2,797 (-2,794 / -2,716) | -2,331 (-2,470 / -2,194) | -1,878 (-2,200 / -1,680) |
What is T. Rowe Price’s dividend yield today?
The current valuation is modest. The trailing P/E is 10.8 times, while the forward P/E is 10.5 times. The first compares the share price with recent profit; the second uses an estimate of the next 12 months’ profit. The stock also offers a 6.5% free cash flow yield and a 4.9% dividend yield. These are related returns to shareholders, not two amounts to add together.