T. Rowe Price stock forecast 2027–2029
MyStockButler's October 2026 analysis: T. Rowe Price's weighted share-price forecast is $104.02 in October 2027. It hinges first on Q4 2026 flows.
Where could T. Rowe Price's shares be by 2029?
Our weighted share-price forecast is $104.02 in October 2027, implying a 2% return. It reaches $108.77 in October 2029, implying a 17% return. Bear carries 30%. Base carries 55%. Bull carries 15%. The view turns first on Q4 2026 flows, then on 2027 expenses and the fee rate. T. Rowe Price’s acquisition of F/m, an investment firm, is expected to close in Q1 2027; subsequent ETF and retirement-plan wins would support the bull case. T. Rowe Price is a large fee-based asset manager whose outlook depends first on flows, then on expenses, fee rates and growth in ETFs and retirement plans.
The weighted share price is $104.02 in October 2027, implying a 2% total return from today’s $106.63 after including dividends. It reaches $105.82 in October 2028, a 9% return, and $108.77 in October 2029, a 17% return. By the last date, the bear case gives $66.11 while the bull case gives $156.25.
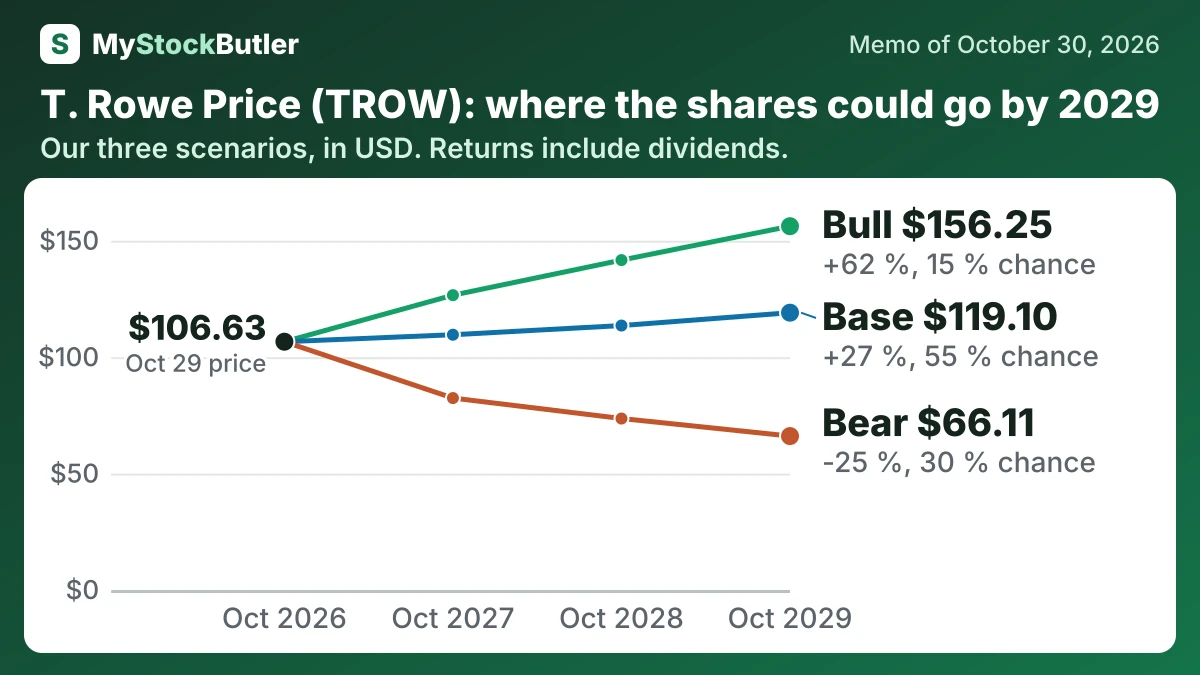
| Case | Probability | October 2027 | October 2028 | October 2029 |
|---|---|---|---|---|
| Bear | 30 % | 82.43 (-18 %) | 73.64 (-22 %) | 66.11 (-25 %) |
| Base | 55 % | 109.64 (+8 %) | 113.58 (+16 %) | 119.10 (+27 %) |
| Bull | 15 % | 126.62 (+24 %) | 141.69 (+43 %) | 156.25 (+62 %) |
| Weighted | 100 % | 104.02 (+2 %) | 105.82 (+9 %) | 108.77 (+17 %) |
What has to go right for T. Rowe Price, and what could go wrong?
The forecast’s central operating-profit path is $2,548 million in October 2027, rising to $2,699 million by October 2029. That starts close to the $2,518 million five-year average and the latest four-quarter total of $2,462 million. The base case assumes moderate revenue recovery, limited margin expansion and outflows that ease but do not disappear. The bear case falls to $1,849 million in 2028 because redemptions and lower-fee replacement assets overwhelm cost flexibility. The bull case reaches $3,198 million as ETF, F/m and retirement distribution produce stronger assets and operating leverage.
| October 2027 | October 2028 | October 2029 | |
|---|---|---|---|
| Normal operating profit | 2,548 (2,002 / 2,800) | 2,622 (1,849 / 3,000) | 2,699 (1,952 / 3,198) |
| Shares (millions) | 209 (211 / 207) | 205 (209 / 202) | 202 (208 / 197) |
| Dividends per share | 5.20 (5.20 / 5.20) | 5.40 (4.16 / 5.60) | 5.60 (4.16 / 6.00) |
| Enterprise value to normal operating profit | 7.90 (7.30 / 8.40) | 8.00 (7.00 / 8.80) | 8.20 (5.90 / 9.10) |
| Net debt | -2,797 (-2,794 / -2,716) | -2,331 (-2,470 / -2,194) | -1,878 (-2,200 / -1,680) |
How much cash does T. Rowe Price really make?
Stock compensation makes the calculation more conservative. T. Rowe Price recorded $216.9 million of stock-based awards in 2025. The expense is not necessarily a cash payment that year, but issuing shares can dilute existing owners, so deducting it estimates cash available to them more strictly.
| 2025 | 2024 | 2023 | 2022 | 2021 | |
|---|---|---|---|---|---|
| Cash from operations | 1,753.4 | 1,685.6 | 1,219.1 | 2,359.4 | 3,452.0 |
| − Capital spending | 274.2 | 423.4 | 307.9 | 237.6 | 239.1 |
| = Free cash flow | 1,479.2 | 1,262.2 | 911.2 | 2,121.8 | 3,212.9 |
| − Stock pay | 216.9 | 247.3 | 265.6 | 285.4 | 274.6 |
| = Real free cash flow | 1,262.3 | 1,014.9 | 645.6 | 1,836.4 | 2,938.3 |
What this means. Cash from operations includes money moving through investment products the company consolidates, so it is not only cash generated by the company's own business.
What does an investor pay for T. Rowe Price today?
The current valuation is modest. The trailing P/E is 10.8 times, while the forward P/E is 10.5 times. The first compares the share price with recent profit; the second uses an estimate of the next 12 months’ profit. The stock also offers a 6.5% free cash flow yield and a 4.9% dividend yield. These are related returns to shareholders, not two amounts to add together.