Invesco stock forecast 2027–2029
MyStockButler's October 2026 analysis: The weighted forecast is $36.82 by October 2027. It hinges on flows, fee yield and lasting savings from retiring old software and contracts.
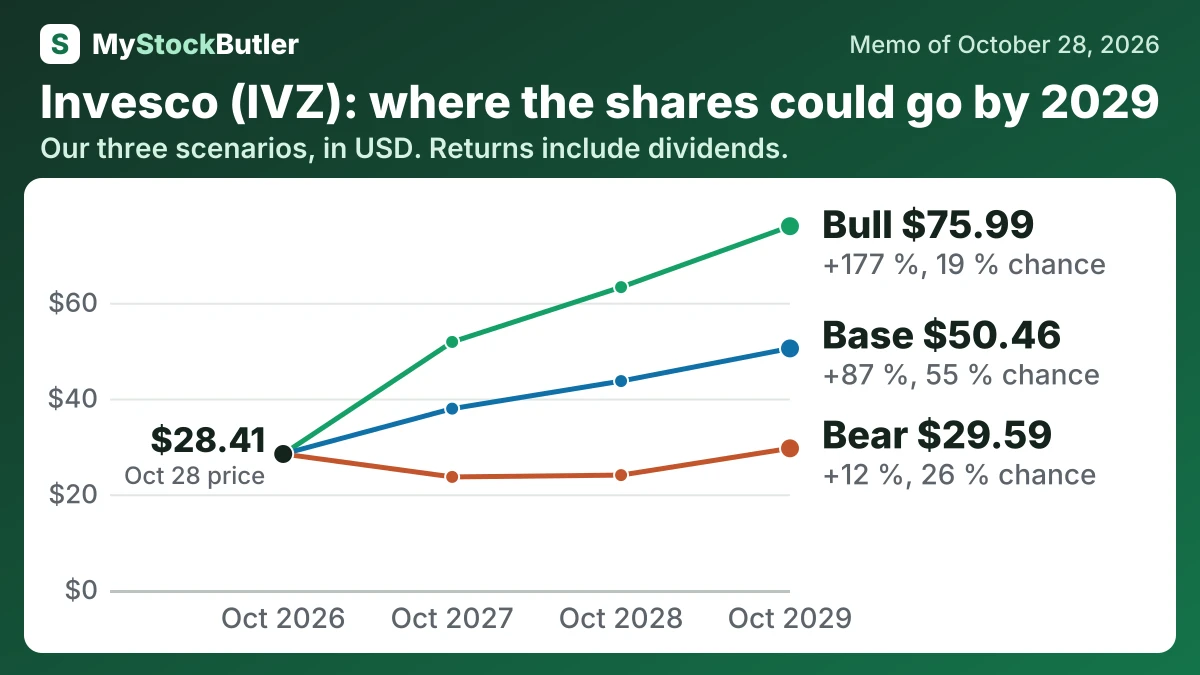
Where could Invesco's shares be by October 2029?
The forecast puts Invesco’s weighted share price at $36.82 by October 2027, a 33% total return with dividends. By October 2028, it reaches $42.26, a 55% return. By October 2029, it reaches $49.88, an 85% return.
| Case | Probability | October 2027 | October 2028 | October 2029 |
|---|---|---|---|---|
| Bear | 26 % | 23.62 (-14 %) | 24.00 (-10 %) | 29.59 (+12 %) |
| Base | 55 % | 37.88 (+36 %) | 43.64 (+60 %) | 50.46 (+87 %) |
| Bull | 19 % | 51.81 (+85 %) | 63.26 (+129 %) | 75.99 (+177 %) |
| Weighted | 100 % | 36.82 (+33 %) | 42.26 (+55 %) | 49.88 (+85 %) |
What this means. The Weighted row is a probability-based average of the three cases, not a guaranteed share price.
What has to go right for Invesco, and what could go wrong?
The bear case becomes more likely if markets fall, particularly in large Nasdaq holdings, during 2027–2029. QQQ’s AUM and fee base would decline even without withdrawals. Persistent fundamental-equity outflows or migration into cheaper products would further reduce revenue yield.
The base case gains support if the implementation charge becomes immaterial in early 2027 and legacy systems retire through 2028. The bull case gains support if those milestones produce visible savings rather than merely replacing old costs.
| October 2027 | October 2028 | October 2029 | |
|---|---|---|---|
| Normal operating profit | 1,764 (1,378 / 1,950) | 1,836 (1,269 / 2,160) | 1,935 (1,397 / 2,378) |
| Shares (millions) | 436 (439 / 432) | 432 (438 / 426) | 429 (437 / 420) |
| Dividends per share | 0.86 (0.86 / 0.86) | 0.90 (0.72 / 0.94) | 0.94 (0.64 / 1.02) |
| Enterprise value to normal operating profit | 10.00 (8.50 / 12.00) | 10.50 (9.00 / 12.50) | 11.00 (9.50 / 13.00) |
| Net debt | 1,140 (1,350 / 1,010) | 423 (905 / 72.30) | -355 (327 / -1,002) |
What this means. A negative net debt number means the company has more cash than borrowed money.
How much cash does Invesco really make?
Deducting $80.0 million of stock pay produces “real free cash flow” of $1,361.0 million. This is a conservative analytical view that treats stock awards as an economic cost, although issuing shares does not consume cash like salaries do.
| 2025 | 2024 | 2023 | 2022 | 2021 | |
|---|---|---|---|---|---|
| Cash from operations | 1,525.3 | 1,190.0 | 1,300.8 | 703.2 | 1,078.1 |
| − Capital spending | 84.3 | 69.1 | 164.3 | 192.9 | 108.8 |
| = Free cash flow | 1,441.0 | 1,120.9 | 1,136.5 | 510.3 | 969.3 |
| − Stock pay | 80.0 | 104.6 | 114.6 | 106.2 | 140.1 |
| = Real free cash flow | 1,361.0 | 1,016.3 | 1,021.9 | 404.1 | 829.2 |
| Real free cash flow, % of revenue | 21.3% | 16.8% | 17.9% | 6.7% | 12.0% |
What this means. Real free cash flow is lower because we subtract shares given to employees, even though no cash was paid, since those shares reduce existing owners’ share of the company.
What does an investor pay for Invesco today?
The trailing P/E is not meaningful, while the 10.2-times forward P/E implies about $2.78 in earnings per share over the next 12 months. The stated 11.5% free-cash-flow yield implies roughly $1.44 billion of annual cash generation. Both figures look attractive only if markets, flows, fees and costs remain favorable.