STMicroelectronics earnings date and guidance
MyStockButler's November 2026 analysis: STMicroelectronics expects to report its next results on January 28, 2027. The key watch is whether STMicroelectronics' silicon-carbide factories turn customer interest into dependable, economical output.
What has STMicroelectronics guided for the year?
For Q4 2026, ST forecasts midpoint revenue of $4.15 billion, with sequential growth of 7%–14% and gross margin of 37%–41%. Gross margin is the share of sales left after direct manufacturing costs. At the midpoint of 39%, ST would keep about 39 cents from each sales dollar before research, selling and administrative expenses. The forecast implies full-year 2026 revenue of $14.5 billion and reported gross margin of 36.4%.
| Period | Low | High | Given on | |
|---|---|---|---|---|
| Net revenues (mid-point) | Quarter to Dec 2026 | 4,150 | 4,150 | Oct 29, 2026 |
| Net revenues, sequential growth | Quarter to Dec 2026 | 7.0% | 14.0% | Oct 29, 2026 |
| Gross margin | Quarter to Dec 2026 | 37.0% | 41.0% | Oct 29, 2026 |
| Net revenues (mid-point) | Year to Dec 2026 | 14,500 | 14,500 | Oct 29, 2026 |
| Gross margin | Year to Dec 2026 | 36.4% | 36.4% | Oct 29, 2026 |
| Datacenter revenue | Year to Dec 2026 | 1,300 | 1,300 | Oct 29, 2026 |
| Datacenter revenue | Year to Dec 2027 | 2,000 | Oct 29, 2026 | |
| Net Capex (non-U.S. GAAP) | Year to Dec 2026 | 2,000 | 2,200 | Jul 30, 2026 |
| Annual cost savings in operating expenses (SG&A and R&D) | Exiting Dec 2027 | 300 | 360 | Jan 30, 2025 |
Has STMicroelectronics kept its past promises?
ST’s quarterly guidance has been dependable: across eight comparable quarters, both revenue and gross margin landed within their ranges. That record does not make every longer-term plan fixed. ST reduced its 2025 annual capex plan from an initial range to slightly below $2 billion as conditions changed. The promises table separates quarterly forecasts from the record of keeping them.
| What management forecast | Checked | Above | Within | Below |
|---|---|---|---|---|
| Net revenues | 8 quarters | 0 | 8 | 0 |
| Gross margin | 8 quarters | 0 | 8 | 0 |
What is STMicroelectronics' revenue and profit trend?
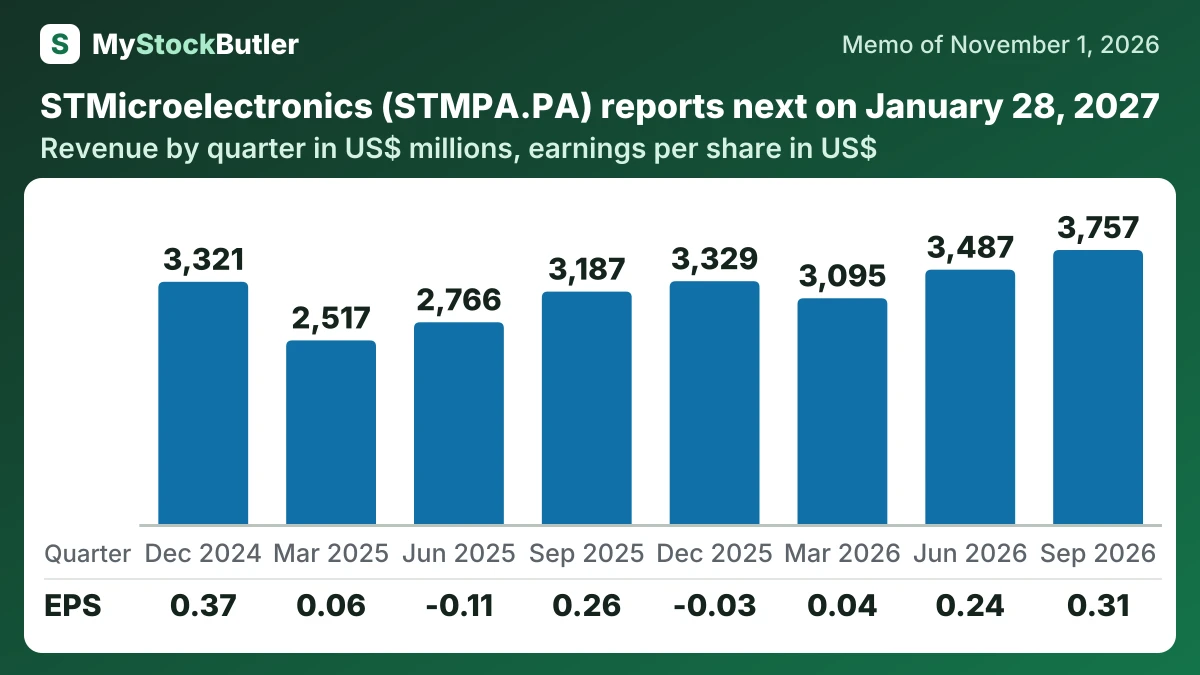
Revenue reached $3.8 billion, up 17.9% from a year earlier. Gross margin rose to 37.3% from 33.2%, while operating income rose to $367 million from $180 million. ST attributed the margin improvement mainly to lower unused-capacity charges and better product mix.
Net income rose to $291 million, or $0.31 per diluted share. After the combined manufacturing and acquisition-accounting adjustment, adjusted operating income was $429 million and adjusted net income was $344 million.
| Sep 2026 | Jun 2026 | Mar 2026 | Dec 2025 | Sep 2025 | Jun 2025 | Mar 2025 | Dec 2024 | |
|---|---|---|---|---|---|---|---|---|
| Revenue | 3,757 | 3,487 | 3,095 | 3,329 | 3,187 | 2,766 | 2,517 | 3,321 |
| Gross margin | 37.3% | 34.8% | 33.8% | 35.2% | 33.2% | 33.5% | 33.4% | 37.7% |
| Operating income | 367 | 187 | 70 | 125 | 180 | -133 | 3 | 369 |
| Net income | 291 | 222 | 37 | -30 | 237 | -97 | 56 | 341 |
| EPS, diluted | 0.31 | 0.24 | 0.04 | -0.03 | 0.26 | -0.11 | 0.06 | 0.37 |
What this means. Free cash flow for September 2026 is blank because the latest report did not separately show lease payments, so the full amount cannot yet be calculated.
What should I watch in STMicroelectronics' next results?
The most revealing test is whether ST’s SiC factories turn customer interest into dependable, economical output.