STMicroelectronics stock forecast 2027–2029
MyStockButler's November 2026 analysis: The weighted price is €31.89 by November 2027 and €49.86 by November 2029, with the bear case at 30%, the base case at 55%, and the bull case at 15%. It hinges on fuller factories, durable demand and profitable SiC output turning guidance into cash.
Where could STMicroelectronics’ shares be by November 2029?
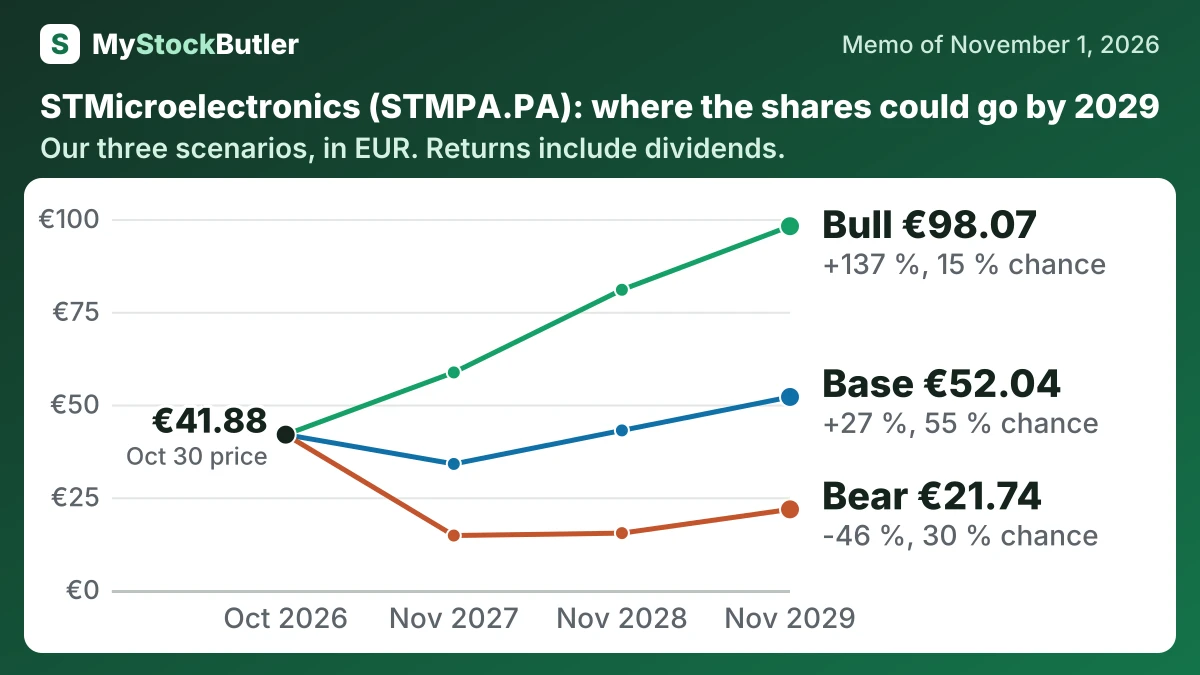
Our weighted price is €31.89 by November 2027, a 23% loss, and €49.86 by November 2029, a 21% gain. Returns include dividends. The bear case has 30% probability, the base case 55%, and the bull case 15%.
| Case | Probability | November 2027 | November 2028 | November 2029 |
|---|---|---|---|---|
| Bear | 30 % | 14.68 (-64 %) | 15.33 (-62 %) | 21.74 (-46 %) |
| Base | 55 % | 33.98 (-18 %) | 43.02 (+4 %) | 52.04 (+27 %) |
| Bull | 15 % | 58.65 (+41 %) | 80.93 (+95 %) | 98.07 (+137 %) |
| Weighted | 100 % | 31.89 (-23 %) | 40.40 (-2 %) | 49.86 (+21 %) |
What has to go right or wrong for STMicroelectronics?
The bear case assumes the 2026 rebound is partly channel replenishment. Weaker vehicle and industrial orders, underused SiC capacity and high capex hold down cash and margins. The price falls to €14.68 by November 2027 and reaches only €21.74 by November 2029. Its probability is 30% because OEM and Tier 1 inventory remains uncertain, although improved Q3 loading makes it less likely than the base case.
The base case gives €33.98 initially and €52.04 at the final date. Its 55% probability reflects delivered quarterly guidance, improving Q3 results and a gradual recovery that does not require peak-cycle profitability. It still depends on data-center growth, cost savings and profitable SiC shipments.
| November 2027 | November 2028 | November 2029 | |
|---|---|---|---|
| Normal operating profit | 2,236 (1,250 / 3,098) | 2,790 (1,400 / 4,040) | 3,315 (2,000 / 4,620) |
| Shares (millions) | 902 (900 / 905) | 908 (904 / 914) | 914 (908 / 923) |
| Dividends per share | 0.36 (0.36 / 0.40) | 0.36 (0.24 / 0.48) | 0.40 (0.24 / 0.60) |
| Enterprise value to normal operating profit | 14.00 (10.00 / 18.00) | 14.00 (9.00 / 19.00) | 14.00 (9.00 / 20.00) |
| Net debt | -2,923 (-2,251 / -3,528) | -4,558 (-2,875 / -5,895) | -6,709 (-4,041 / -8,773) |
How much cash does STMicroelectronics really make?
Capital spending was $2.1 billion in 2025. Under the calculation used here, free cash flow was only $29 million; after subtracting $193 million of stock-based pay, analytical “real free cash flow” was negative $164 million. Stock pay is not a cash payment in that period, but it is a cost borne by shareholders.
| 2025 | 2024 | 2023 | 2022 | 2021 | |
|---|---|---|---|---|---|
| = Free cash flow | 29 | -127 | 1,552 | 1,653 | 1,220 |
| − Stock pay | 193 | 222 | 236 | 215 | 221 |
| = Real free cash flow | -164 | -349 | 1,316 | 1,438 | 999 |
| Free cash flow, % of revenue | 0.2% | -1.0% | 9.0% | 10.2% | 9.6% |
| Real free cash flow, % of revenue | -1.4% | -2.6% | 7.6% | 8.9% | 7.8% |
What this means. The company's own free cash flow is higher because it leaves out 236 million dollars of cash spending that we count, so its 265 million dollars is not directly comparable with our 29 million dollars.
What does an investor pay for STMicroelectronics today?
The valuation measures tell different parts of the story. A trailing P/E compares the share price with recent earnings, while a forward P/E compares it with expected earnings. The forward measure looks far more comfortable because it assumes profit will rebound. Enterprise value to EBITDA uses earnings before interest, tax, depreciation and amortization, but depreciation represents the gradual consumption of costly factories and equipment. Price to book says what investors pay relative to recorded equity, yet book value cannot show whether a factory is busy and profitable.