STMicroelectronics dividend
MyStockButler's November 2026 analysis: STMicroelectronics' latest full-year dividend was $0.36 per share, and the base case keeps it at $0.36 through November 2028 before rising to $0.40. Cash coverage is strained: 2025 free cash flow was only $29 million, and real free cash flow was negative $164 million after stock-based pay.
How much does STMicroelectronics pay in dividends?
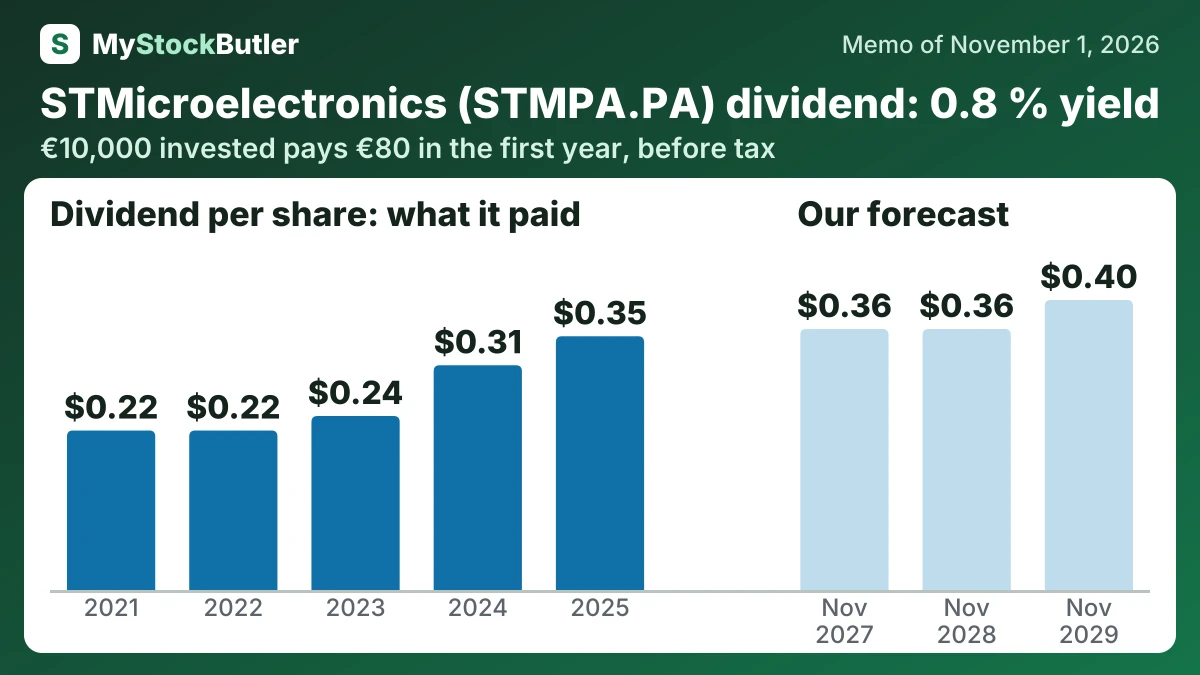
The base dividend stays at $0.36 through November 2028 before rising to $0.40. The latest full-year dividend was $0.36, but planned capex of $2.0–$2.2 billion and weak 2025 cash flow argue against faster increases. The bear case returns to $0.24, the level paid from 2021 to 2023. The bull case reaches $0.60 as earnings and cash recover.
| 2025 | 2024 | 2023 | 2022 | 2021 | |
|---|---|---|---|---|---|
| Net income | 166 | 1,557 | 4,211 | 3,960 | 2,000 |
| EPS, diluted | 0.18 | 1.66 | 4.46 | 4.19 | 2.16 |
| Dividend per share | 0.36 | 0.36 | 0.24 | 0.24 | 0.24 |
What this means. The 2023 profit looks higher partly because it included a one-time tax benefit that did not bring in cash.
How much would STMicroelectronics's dividend pay you?
€10,000 invested in STMicroelectronics at its 0.8% dividend yield (our report of November 1, 2026) pays €80.00 in the first year, before tax. If its dividend per share keeps changing 12.3% a year, as it did from 2021 to 2025, and the dividends are reinvested, year 10 pays €256.11, with €1,518.69 received in all.
Before tax. Past dividend growth is not a promise. Information only, not investment advice.
Is STMicroelectronics' dividend covered by its cash?
Capital spending was $2.1 billion in 2025. Under the calculation used here, free cash flow was only $29 million; after subtracting $193 million of stock-based pay, analytical “real free cash flow” was negative $164 million. Stock pay is not a cash payment in that period, but it is a cost borne by shareholders.
ST’s own free-cash-flow measure was $265 million because it uses net capital expenditure and includes grants and other asset transactions. The definition matters: the factories still require substantial investment through the cycle.
| 2025 | 2024 | 2023 | 2022 | 2021 | |
|---|---|---|---|---|---|
| = Free cash flow | 29 | -127 | 1,552 | 1,653 | 1,220 |
| = Real free cash flow | -164 | -349 | 1,316 | 1,438 | 999 |
| Free cash flow — the company's own count | 265 | 288 | 1,774 | 1,591 | 1,120 |
What this means. The company's own free cash flow is higher because it leaves out 236 million dollars of cash spending that we count, so its 265 million dollars is not directly comparable with our 29 million dollars.
What could change STMicroelectronics' dividend?
| November 2027 | November 2028 | November 2029 | |
|---|---|---|---|
| Normal operating profit | 2,236 (1,250 / 3,098) | 2,790 (1,400 / 4,040) | 3,315 (2,000 / 4,620) |
| Dividends per share | 0.36 (0.36 / 0.40) | 0.36 (0.24 / 0.48) | 0.40 (0.24 / 0.60) |
| Net debt | -2,923 (-2,251 / -3,528) | -4,558 (-2,875 / -5,895) | -6,709 (-4,041 / -8,773) |
What is STMicroelectronics' dividend yield today?
Free cash flow is the cash left after operating the business and paying for investment. ST planned $2.0 billion–$2.2 billion of net capital expenditure in 2026, while it reported negative $40 million of free cash flow for the 12 months through Q3 2026. That gap matters: a provider’s positive cash-flow yield cannot automatically be treated as cash available for dividends.