Spirax dividend
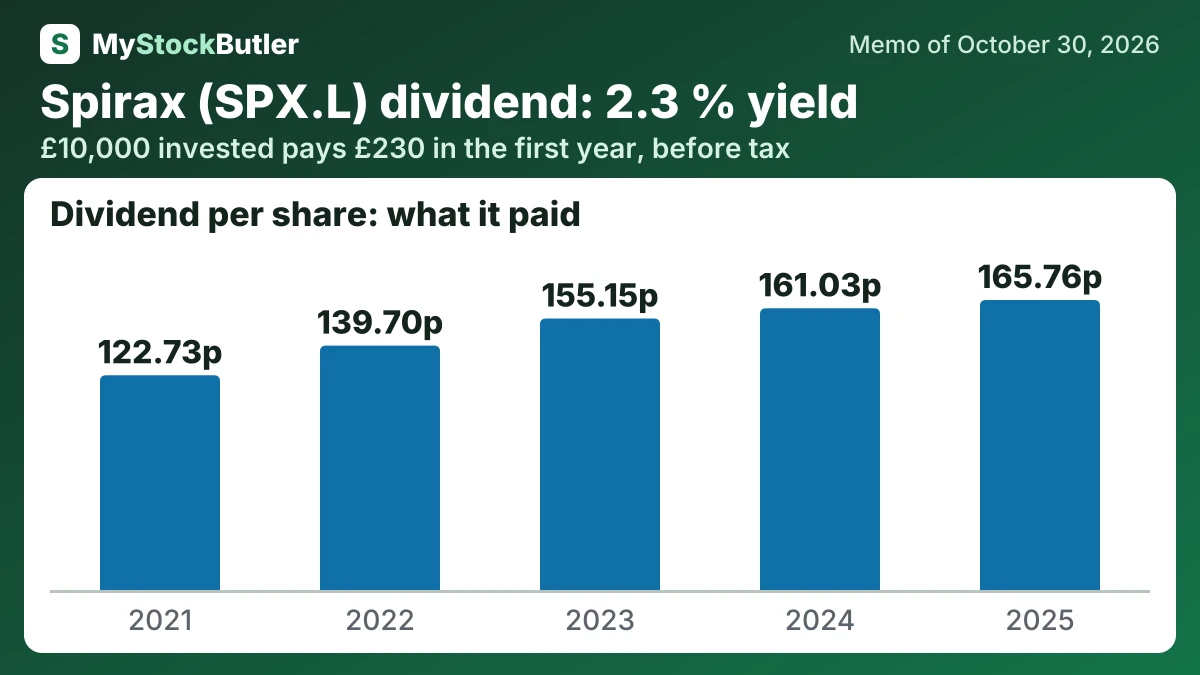
MyStockButler's October 2026 analysis: Spirax has paid dividends every year; in 2022, the dividend absorbed almost all free cash flow. Spirax's dividend is covered by cash generation, but coverage was tight in 2022.
How much does Spirax pay per share?
Base dividends are £1.80 in the first window and £1.85 in the second. They reach £1.90 in the third, extending the recent roughly 3% growth rate. The bear holds dividends at £1.70 because cash conversion was only 54% in the first half. The bull reaches £1.85, £1.95 and £2.05 as stronger cash conversion supports faster increases.
| October 2027 | October 2028 | October 2029 | |
|---|---|---|---|
| Earnings | 239 (203 / 253) | 255 (204 / 281) | 271 (205 / 314) |
| Shares (millions) | 73.78 (73.78 / 73.78) | 73.78 (73.78 / 73.78) | 73.78 (73.78 / 73.78) |
| Dividends per share | 1.80 (1.70 / 1.85) | 1.85 (1.70 / 1.95) | 1.90 (1.70 / 2.05) |
| Price to earnings | 24.00 (19.00 / 27.00) | 23.00 (18.00 / 29.00) | 22.00 (17.00 / 30.00) |
How much would Spirax's dividend pay you?
£10,000 invested in Spirax at its 2.3% dividend yield (our report of October 30, 2026) pays £230.00 in the first year, before tax. If its dividend per share keeps changing 7.8% a year, as it did from 2021 to 2025, and the dividends are reinvested, year 10 pays £598.62, with £3,833.79 received in all.
Before tax. Past dividend growth is not a promise. Information only, not investment advice.
Is Spirax's dividend covered by its cash?
Free cash flow is the cash left after running the business and making the capital investments included in its calculation. From 2021 through 2025, Spirax paid dividends every year and made no share buybacks. In 2022, the dividend absorbed almost all free cash flow, while acquisitions required far more cash than ordinary operations retained.
Free cash flow is a more demanding measure because it subtracts investment and financing costs. In 2025, cash from operations was £296.2 million; after capital spending, lease payments and interest, the table’s free-cash-flow calculation was £185.1 million. Spirax’s own adjusted figure was £199.0 million because it uses a different reconciliation. Neither figure says exactly how much investment merely maintains the existing business.
| 2025 | 2024 | 2023 | 2022 | 2021 | |
|---|---|---|---|---|---|
| Free cash flow | 185.1 | 167.1 | 149.4 | 108.4 | 200.4 |
| − Dividends paid | 122.5 | 119.0 | 114.5 | 103.1 | 90.7 |
| − Share buybacks | 0 | 0 | 0 | 0 | 0 |
| = Free cash flow not paid out | 62.3 | 47.8 | 34.5 | 4.8 | 109.4 |
| Paid to shareholders | 122.5 | 119.0 | 114.5 | 103.1 | 90.7 |
| Paid out, % of free cash flow | 66.2% | 71.2% | 76.6% | 95.1% | 45.3% |
What could change Spirax's dividend?
The bear view would gain weight during 2027–2029 if project delays reduce growth, ETS throughput remains weak or WMFTS orders convert slowly. Inventory absorbing cash would also keep net debt higher.
What is Spirax's dividend yield today?
Spirax is priced as a business that can grow profits and turn them into cash reliably. The stated share price on 30 October 2026 values the shareholders’ claim on the company.
| Today (Oct 30, 2026) | |
|---|---|
| Share price | 7540.00 |
| Market value (calculated) | 5,566.5 |
| Free cash flow yield (calculated) | 3.3% |
| Dividend yield (calculated) | 2.3% |
What this means. Enterprise value is higher than market value because it includes the company's debt and subtracts its cash.