Raymond James earnings date and guidance
MyStockButler's October 2026 analysis: Raymond James is expected to report results on October 28, 2026. Raymond James will be watched for whether fee growth, completed deals, and expense control turn growth into durable profit.
What has Raymond James guided for the year?
Management’s operating targets measure two different things. The compensation ratio shows how much revenue goes to employees and advisors. The pre-tax margin shows what remains before tax after other expenses. On $100 of revenue, the first target would send about two-thirds to compensation, while the second would leave about one-fifth before tax. “Adjusted” removes costs management treats as unusual or separate, including some acquisition expenses. That makes the continuing business easier to compare, but it can also hide part of the bill that cash must still pay.
| Period it covers | Low | High | Date given | |
|---|---|---|---|---|
| Adjusted compensation ratio | Ongoing financial target | 65.0% | 65.0% | May 27, 2026 |
| Adjusted pre-tax margin | Ongoing financial target | 20.0% | 20.0% | May 27, 2026 |
| Adjusted return on common equity | Ongoing financial target | 17.0% | May 27, 2026 | |
| Adjusted return on tangible common equity | Ongoing financial target | 20.0% | May 27, 2026 | |
| Full year effective tax rate | Fiscal 2026 | 25.0% | 25.0% | May 27, 2026 |
| Net revenues | By fiscal 2030 | 20 | Jun 5, 2025 |
What this means. The 20% to 30% common stock dividend target is the share of earnings paid to shareholders, not a 20% to 30% return on the stock.
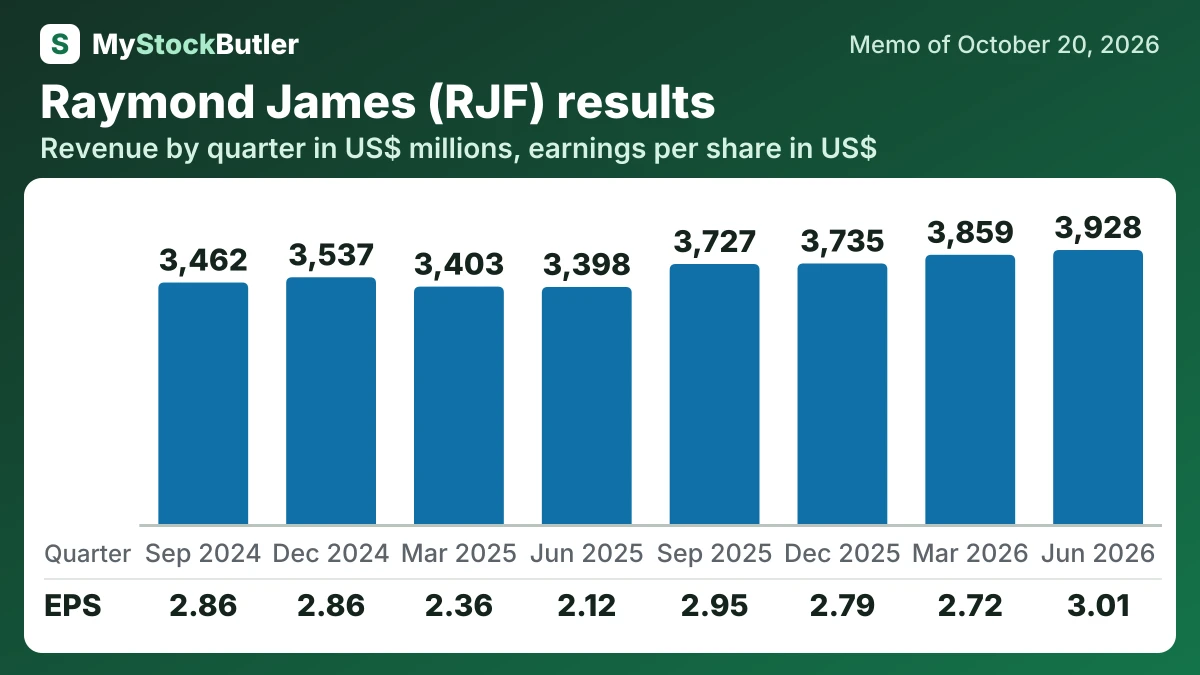
What are Raymond James’s last eight quarters of revenue and profit?
June 2026 was stronger, but comparison effects amplified the rebound. Revenue reached $3,928 million, against $3,398 million a year earlier. Net income rose from $436 million to $595 million, while diluted EPS rose from $2.12 to $3.01.
| Jun 2026 | Mar 2026 | Dec 2025 | Sep 2025 | Jun 2025 | Mar 2025 | Dec 2024 | Sep 2024 | |
|---|---|---|---|---|---|---|---|---|
| Revenue | 3,928 | 3,859 | 3,735 | 3,727 | 3,398 | 3,403 | 3,537 | 3,462 |
| Net interest income | 560 | 557 | 566 | 551 | 546 | 521 | 529 | 532 |
| Net income | 595 | 544 | 563 | 604 | 436 | 495 | 600 | 602 |
| EPS, diluted | 3.01 | 2.72 | 2.79 | 2.95 | 2.12 | 2.36 | 2.86 | 2.86 |
| Net interest margin | 2.7% | 2.7% | 2.8% | 2.8% | 2.8% | 2.8% | 2.7% | 2.9% |
| Pretax margin | 19.1% | 19.0% | 19.5% | 19.6% | 16.6% | 19.7% | 21.2% | 22.0% |
What this means. These figures are for individual quarters, not full years, even though some row descriptions say “year.”
What should I watch in Raymond James’s next results?
Raymond James is scheduled to report fiscal fourth-quarter and full-year results on October 28, 2026. Investors will want to see whether fee growth followed management’s outlook, whether investment-banking deals closed and whether expenses allowed more revenue to become profit.
Quarterly professional fees rose $27 million sequentially to $63 million, mostly because of sweep-litigation costs, and management expected further expense. A smaller settlement would not necessarily remove the long-term risk if client cash became more expensive. That risk matters because the group’s capital is shared, but not freely movable.