Raymond James stock forecast 2027–2029
MyStockButler's October 2026 analysis: Raymond James's weighted forecast is $179.81 in October 2027, with a 55% base-case probability. It hinges on domestic net new assets and fee-based asset growth converting into stronger margins and buybacks.
Where could Raymond James's shares go?
The weighted forecast is $179.81 in October 2027, a 17% return including dividends. It reaches $215.75 in October 2029, a 44% return including dividends. The bear case has 25% probability. The base case has 55%; the bull case has 20%.
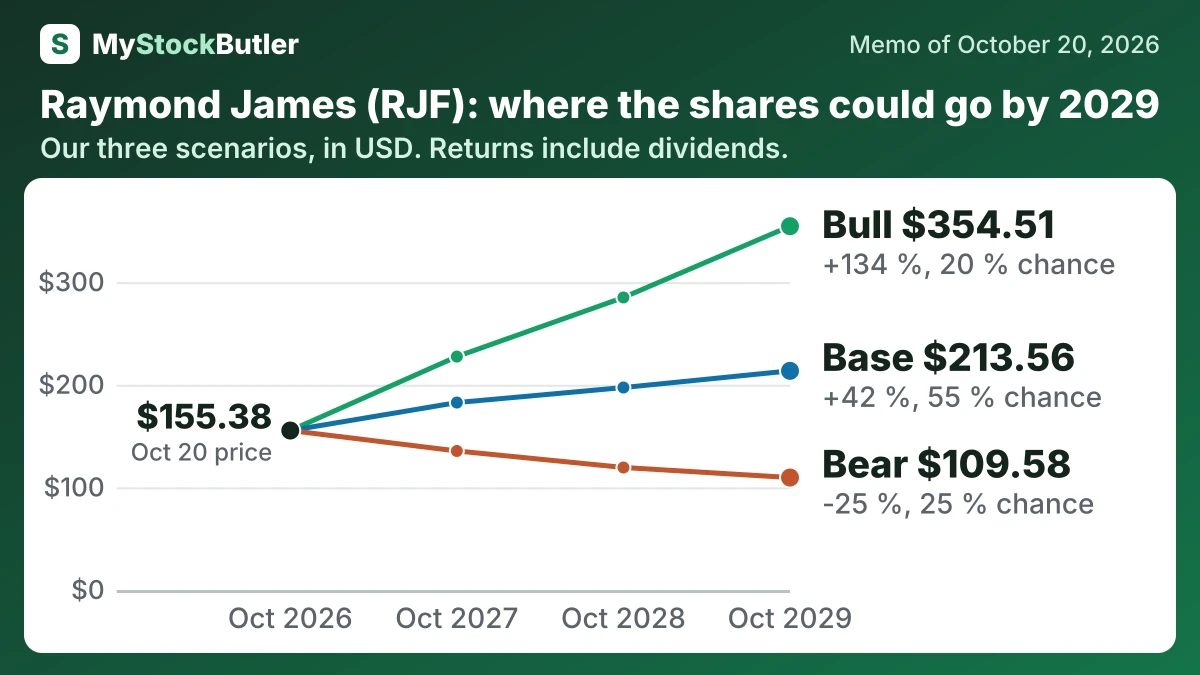
| Case | Probability | October 2027 | October 2028 | October 2029 |
|---|---|---|---|---|
| Bear | 25 % | 135.47 (-11 %) | 119.37 (-20 %) | 109.58 (-25 %) |
| Base | 55 % | 182.65 (+19 %) | 197.31 (+30 %) | 213.56 (+42 %) |
| Bull | 20 % | 227.45 (+48 %) | 285.06 (+87 %) | 354.51 (+134 %) |
| Weighted | 100 % | 179.81 (+17 %) | 195.37 (+29 %) | 215.75 (+44 %) |
What has to go right or wrong for Raymond James?
The base remains below the $2,830 million earnings implied by the next-twelve-month analyst estimate at first, then grows as fee assets expand and costs moderate. Domestic net new assets reached $75.5 billion in the first nine months of fiscal 2026, and fee-based assets reached $1,150 billion. The bear case reflects weaker flows, advisor-cost pressure and bank NIM compression; the bull case assumes technology and productivity expand margins toward stronger normalized levels.
How much cash does Raymond James really make?
Cash flow also needs context. Operating cash flow was $2,434 million in fiscal 2025, while capital expenditure was $188 million. Lending, deposits, brokerage balances, compliance and people do not fit neatly into ordinary free-cash-flow analysis. Common equity rose from $8,245 million in fiscal 2021 to $12,424 million in fiscal 2025, but capital must also support lending, acquisitions and recruiting.
Shareholder returns currently rely more on buybacks than dividends. In the June 2026 quarter, common dividends were $106 million and repurchases were $400 million. A dividend pays every shareholder cash; a buyback leaves each remaining share with a larger ownership claim. Diluted average shares fell to 197.2 million from 205.5 million a year earlier, which supports earnings per share if repurchases do not weaken capital.
What does an investor pay for Raymond James today?
Raymond James looks inexpensive only if its forecast earnings can last. At $155.38, the stock trades at a trailing P/E of 13.5x and a forward P/E of 10.8x. P/E means the price investors pay for each dollar of earnings. A $135 share earning $10 has this kind of multiple; at the same price, 10.8x implies about 25% more earnings. That increase might come from higher fees, stronger banking profits, or fewer shares.
| Today (Oct 20, 2026) | |
|---|---|
| Share price | 155.38 |
| Market value (calculated) | 29,889.16 |
| P/E, last 12 months (calculated) | 13.5x |
| P/E, next 12 months (calculated) | 10.8x |
| Price to book (calculated) | 2.4x |
| Dividend yield (calculated) | 1.4% |
What this means. The next-12-month price-to-earnings number uses analysts' estimated profit, so it may be wrong if the company earns more or less than expected.