Northern Trust stock forecast 2027–2029
MyStockButler's October 2026 analysis: The weighted scenario puts Northern Trust at $156.18 in October 2027, a 4% decline including dividends. It hinges on turning Northern Trust’s scale into recurring, profitable growth while protecting trust and capital.
Where could Northern Trust’s shares be by October 2029?
The forecast sees limited near-term upside, followed by a stronger three-year outcome. The weighted share price is $156.18 in October 2027, a 4% decline from today after including dividends in the return. It reaches $166.59 in October 2028, a 4% gain, and $181.99 in October 2029, a 16% gain. By the last date, the bear-to-bull range is $98.27 to $248.21, against today’s $166.91.
The base case is likeliest at 53%. The bear case has 27%, while the bull case has 20%.
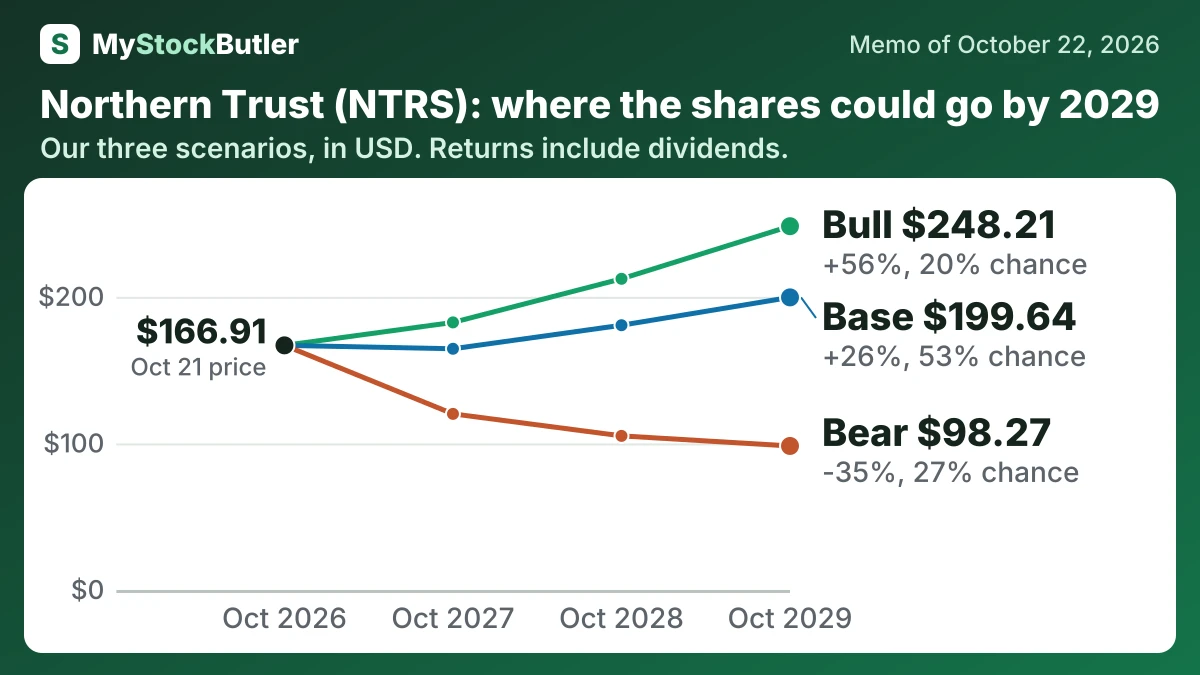
| Case | Probability | October 2027 | October 2028 | October 2029 |
|---|---|---|---|---|
| Bear | 27% | 120.15 (-26%) | 105.14 (-33%) | 98.27 (-35%) |
| Base | 53% | 164.58 (+1%) | 180.65 (+13%) | 199.64 (+26%) |
| Bull | 20% | 182.57 (+12%) | 212.31 (+32%) | 248.21 (+56%) |
| Weighted | 100% | 156.18 (-4%) | 166.59 (+4%) | 181.99 (+16%) |
What this means. The weighted value is the probability-based average of the bear, base, and bull cases, not a separate prediction.
What has to go right for Northern Trust, and what could go wrong?
Book value rises moderately in the base case, from $12,478 million today to $14,578 million by October 2029. The path is $12,998 million, then $13,698 million. It reflects earnings near the consensus run rate, moderate growth and substantial distributions. Common equity nevertheless rose from $10,374.6 million in 2022 to $12,073.0 million in 2025, while Q3 NII grew 14% year over year. The bear path falls to $12,318 million before recovering to $12,768 million as credit losses and weaker earnings slow distributions. The bull reaches $14,938 million through stronger mandates, wealth cross-selling and productivity.
How much cash does Northern Trust really make?
Operating cash flow swung from negative $486 million in 2024 to positive $5.5 billion in 2025. A roughly $2.9 billion collateral inflow helped drive that change. Because collateral may later have to be returned, it is not freely distributable profit. Liquidity for withdrawals, settlements and collateral obligations comes first.
| 2025 | 2024 | 2023 | 2022 | 2021 | |
|---|---|---|---|---|---|
| EPS, diluted | 8.74 | 9.77 | 5.08 | 6.14 | 7.14 |
| − Dividends, per share | 3.10 | 3.00 | 3.00 | 2.90 | 2.80 |
| − Share buybacks, per share | 0.17 | ||||
| = Kept, per share | 3.07 | ||||
| Book value per share | 64.79 | 60.74 | 53.69 | 49.78 | 53.58 |
| Diluted shares (average of the year), change | -4.8% | -2.7% | -0.6% | 0.0% | -0.1% |
What this means. Blank share buyback rows do not mean no buybacks happened; the report could not separate company repurchases from shares withheld for employee taxes.
What does an investor pay for Northern Trust today?
The price-to-earnings ratio, or P/E, tells investors how much they pay for one dollar of annual profit. A trailing P/E uses the last twelve months; a forward P/E uses expected profit over the next twelve months. Here, the forward measure is higher than the trailing one, which suggests that recent earnings contain something unlikely to repeat.
| Today (Oct 22, 2026) | |
|---|---|
| Share price | 166.91 |
| Market value (calculated) | 30,230.4 |
| P/E, last 12 months (calculated) | 13.1x |
| P/E, next 12 months (calculated) | 14.2x |
| Price to book (calculated) | 2.4x |
| Dividend yield (calculated) | 2.1% |
What this means. The next-year price-to-earnings number uses analysts’ expected profit, so it can change when their forecasts change.