Nordson earnings: next results and guidance
MyStockButler's October 2026 analysis: Nordson's next results are expected on December 9, 2026. The key thing to watch is whether backlog becomes shipments and cash, and whether new orders replace delivered work.
What has Nordson guided for fiscal 2026?
On August 19, management raised its fiscal 2026 sales forecast. It set sales at $3.035–$3.075 billion. It set adjusted earnings at $11.80–$12.00 per diluted share. Adjusted earnings remove specified accounting items; diluted earnings spread profit across the existing shares and shares that could be issued through awards or similar instruments.
| Period guided | Low | High | Date given | |
|---|---|---|---|---|
| Sales | Year to Oct 2026 | 3,035 | 3,075 | Aug 19, 2026 |
| Adjusted earnings per diluted share | Year to Oct 2026 | 11.80 | 12.00 | Aug 19, 2026 |
| Fiscal 2026 sales growth | Year to Oct 2026 | 9.0% | 10.0% | Aug 20, 2026 |
| Adjusted earnings growth | Year to Oct 2026 | 15.0% | 17.0% | Aug 20, 2026 |
What this means. The growth percentages are rounded estimates, so the sales and adjusted earnings per share dollar ranges are the more exact guidance.
Has Nordson kept its past promises?
The guidance record is encouraging but limited. Across six comparable quarters, sales and adjusted earnings finished within or above management’s initial ranges, producing a 5/5 score. Neither measure fell below its range, which suggests moderately cautious promises. The record measures performance against management’s own ranges, however, not against analysts’ expectations.
| What management forecast | Checked | Above | Within | Below |
|---|---|---|---|---|
| Sales | 6 quarters | 2 | 4 | 0 |
| Adjusted earnings per diluted share | 6 quarters | 1 | 5 | 0 |
What happened in Nordson's last eight quarters?
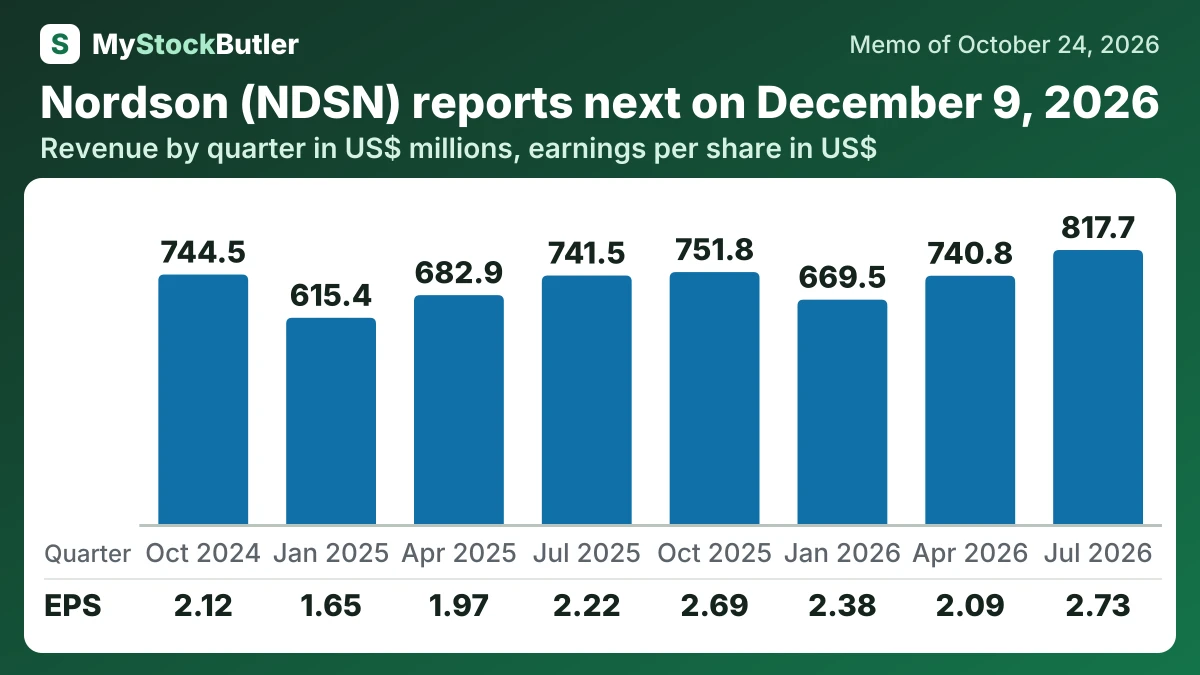
Revenue, operating income and diluted EPS all increased from the prior-year quarter, while gross margin also improved. Organic growth was 11.7% in the quarter. ATS grew organically 30.9% and supplied about 64% of the consolidated sales increase, so the recovery was broad in reporting terms but concentrated in profit momentum.
| Jul 2026 | Apr 2026 | Jan 2026 | Oct 2025 | Jul 2025 | Apr 2025 | Jan 2025 | Oct 2024 | |
|---|---|---|---|---|---|---|---|---|
| Revenue | 817,667 | 740,847 | 669,461 | 751,820 | 741,509 | 682,938 | 615,420 | 744,482 |
| Gross margin | 55.5% | 54.5% | 54.7% | 56.3% | 54.8% | 54.7% | 54.6% | 54.1% |
| Operating income | 223,092 | 197,203 | 166,405 | 214,261 | 187,767 | 168,750 | 140,947 | 178,892 |
| Net income | 152,846 | 117,316 | 133,382 | 151,634 | 125,784 | 112,404 | 94,652 | 122,168 |
| EPS, diluted | 2.73 | 2.09 | 2.38 | 2.69 | 2.22 | 1.97 | 1.65 | 2.12 |
| = Free cash flow | 236,752 | 170,493 | 122,915 | 193,853 | 226,409 | 103,130 | 137,723 | 75,757 |
What this means. The cash numbers are for each quarter, calculated by subtracting the previous year-to-date total from the current one.
What should investors watch in Nordson's next results?
The first checkpoint is the year ending October 31, 2026, followed by full-year results and the initial fiscal 2027 outlook. December 9 is an outside estimate of the reporting date, not a confirmed appointment. The results should show whether backlog became shipments and cash, and whether new orders replaced the work delivered during the year.