Las Vegas Sands stock forecast 2027–2029
MyStockButler's October 2026 analysis: The weighted scenario puts Las Vegas Sands at $39.28 in October 2027. It hinges on whether Macao’s recovery can fund Singapore’s expansion without sacrificing cash conversion.
Where could Las Vegas Sands' shares be by October 2029?
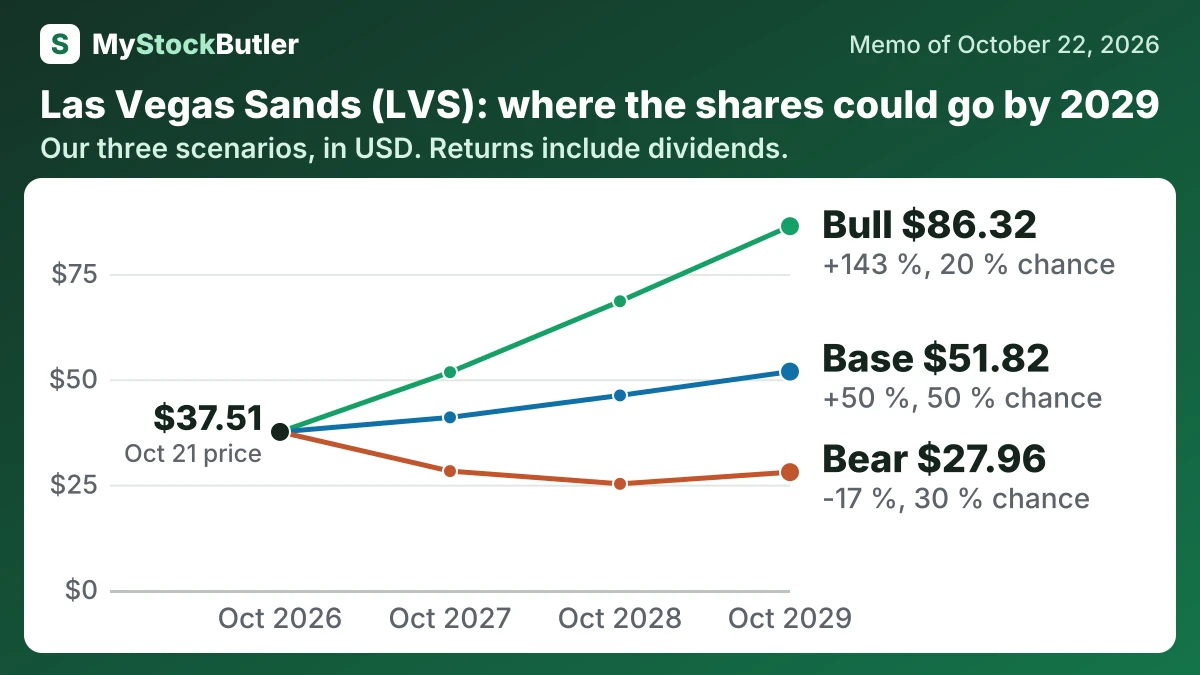
The forecast points to a modest one-year gain, a stronger three-year result, and a wide range of outcomes. The weighted price is $39.28 in October 2027, an 8% return with dividends. It reaches $44.34 in October 2028, or 25%. By October 2029, the weighted price is $51.56, implying a 48% return.
The 2029 range is $27.96 to $86.32. Today’s price is $37.51, so the bear case loses money even after dividends, while the bull case more than doubles the investment.
| Case | Probability | October 2027 | October 2028 | October 2029 |
|---|---|---|---|---|
| Bear | 30 % | 28.21 (-22 %) | 25.19 (-27 %) | 27.96 (-17 %) |
| Base | 50 % | 40.96 (+13 %) | 46.17 (+31 %) | 51.82 (+50 %) |
| Bull | 20 % | 51.68 (+41 %) | 68.51 (+91 %) | 86.32 (+143 %) |
| Weighted | 100 % | 39.28 (+8 %) | 44.34 (+25 %) | 51.56 (+48 %) |
What has to go right for Las Vegas Sands, and what could go wrong?
The base case gives $5,270 million in October 2027. It rises to $5,525 million in 2028 and $5,775 million in 2029. The assumptions are Macao stabilisation, profitable Singapore resorts and Venetian renovation benefits from Chinese New Year 2028. No Singapore expansion EBITDA is included because opening is expected in January 2031. The bear case falls to $4,800 million and then $4,700 million as weaker premium play and promotions outweigh renovation benefits. The bull case reaches $5,550 million and then $6,100 million through stronger mass play and customer spending.
The bull case requires stronger mass-market spending, disciplined promotions and successful Venetian renovation. Singapore’s strong existing resort performance provides additional support, but its expansion contributes nothing before 2031. The path reaches $51.68 first and $86.32 last, with a 20% probability because it requires sustained growth alongside aggressive buybacks and heavy construction spending.
| October 2027 | October 2028 | October 2029 | |
|---|---|---|---|
| EBITDA | 5,270 (4,800 / 5,550) | 5,525 (4,700 / 6,100) | 5,775 (4,850 / 6,600) |
| Shares (millions) | 586 (604 / 573) | 554 (592 / 523) | 529 (582 / 483) |
| Dividends per share | 1.38 (1.20 / 1.38) | 1.44 (1.00 / 1.60) | 1.44 (0.80 / 1.80) |
| Enterprise value to ebitda | 7.10 (6.20 / 7.80) | 7.20 (5.90 / 8.30) | 7.30 (6.00 / 8.70) |
| Net debt | 13,414 (12,736 / 13,676) | 14,210 (12,804 / 14,773) | 14,744 (12,824 / 15,708) |
How much cash does Las Vegas Sands really make?
Free cash flow then deducts capital spending from operating cash flow. Stock compensation needs a further judgment: it uses no immediate cash, but grants employees an ownership claim that can dilute other shareholders or require repurchases. “Real free cash flow” is therefore an analytical measure, not a standard accounting subtotal.
| 2025 | 2024 | 2023 | 2022 | 2021 | |
|---|---|---|---|---|---|
| Cash from operations | 3,023 | 3,204 | 3,227 | -944 | -243 |
| Of which, freed from working capital | 19 | 390 | 164 | ||
| Of which, tied up in working capital | 784 | 89 | |||
| − Capital spending | 1,168 | 1,567 | 1,017 | 651 | 828 |
| = Free cash flow | 1,855 | 1,637 | 2,210 | -1,595 | -1,071 |
| − Stock pay | 54 | 55 | 44 | 39 | 22 |
| = Real free cash flow | 1,801 | 1,582 | 2,166 | -1,634 | -1,093 |
| Free cash flow, % of revenue | 14.3% | 14.5% | 21.3% | -38.8% | -25.3% |
| Real free cash flow, % of revenue | 13.8% | 14.0% | 20.9% | -39.8% | -25.8% |
What this means. Real free cash flow is lower because it subtracts shares given to employees as pay, which uses no cash but gives away part of the company.