Wynn Resorts stock forecast 2027–2029
MyStockButler's October 2026 analysis: The weighted forecast for Wynn Resorts is $50.74 in October 2027, with the path below today’s price through 2028 and roughly breakeven by 2029. It hinges on Macau cash generation and Al Marjan execution without overwhelming the balance sheet.
Where could Wynn Resorts’ shares go?
The forecast gives Wynn a difficult two years and only a flat three-year outcome. The probability-weighted price is $50.74 in October 2027, $57.35 in October 2028 and $70.38 in October 2029, compared with today’s $72.73. Including dividends, those outcomes represent returns of −29%, −19% and approximately 0%.
The forecast assigns 30% to the bear case, 50% to the base case and 20% to the bull case. The base case leads because Wynn’s recent operating profit has stabilized near $1.1 billion, while leverage and project spending make a large upside outcome harder to achieve.
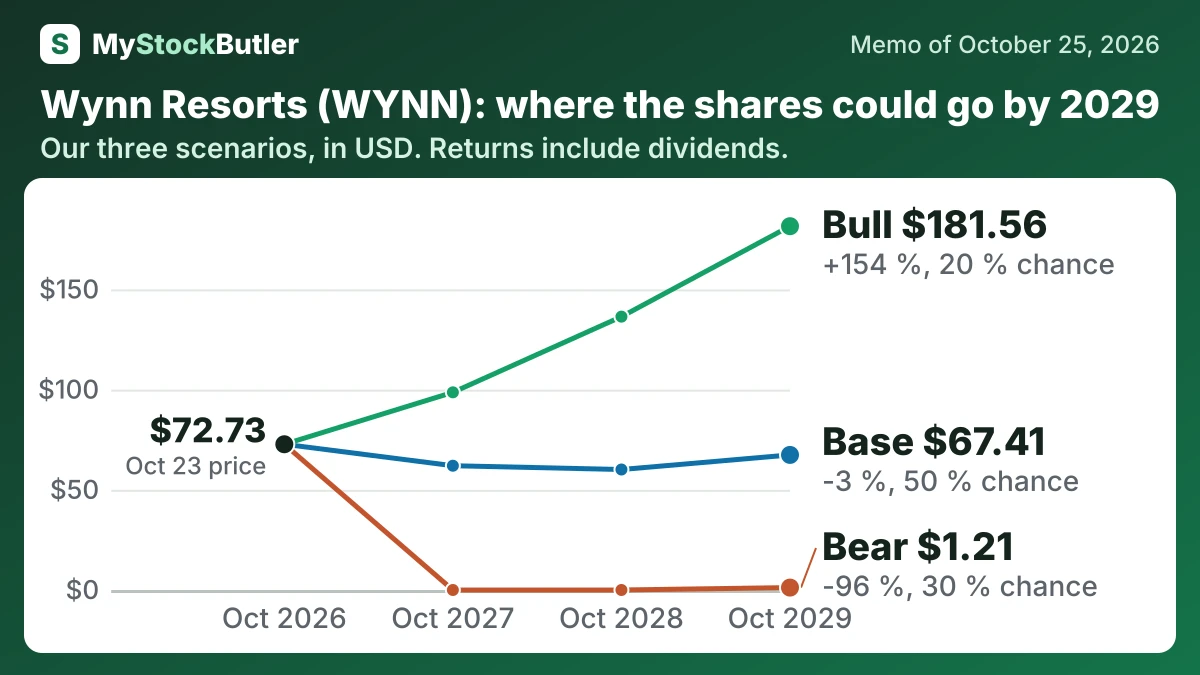
| Case | Probability | October 2027 | October 2028 | October 2029 |
|---|---|---|---|---|
| Bear | 30 % | 0.00 (-99 %) | 0.00 (-98 %) | 1.21 (-96 %) |
| Base | 50 % | 62.02 (-13 %) | 60.13 (-15 %) | 67.41 (-3 %) |
| Bull | 20 % | 98.65 (+37 %) | 136.42 (+90 %) | 181.56 (+154 %) |
| Weighted | 100 % | 50.74 (-29 %) | 57.35 (-19 %) | 70.38 (+0 %) |
What has to go right for Wynn Resorts?
The bear case falls to $850 million before recovering to $1.00 billion as Macau demand and hold weaken and renovation costs bite. The bull case reaches $1.48 billion as Macau volume, Las Vegas pricing and Al Marjan execution combine. Wynn gives no operating-income guidance, so the forecast relies on the operating record and project evidence rather than management targets.
| October 2027 | October 2028 | October 2029 | |
|---|---|---|---|
| Normal operating profit | 1,080 (850 / 1,200) | 1,130 (930 / 1,340) | 1,190 (1,000 / 1,480) |
| Shares (millions) | 102 (103 / 99.61) | 100 (104 / 95.81) | 99.05 (106 / 92.01) |
| Dividends per share | 1.00 (1.00 / 1.00) | 1.00 (0.50 / 1.00) | 1.00 (0.00 / 1.25) |
| Enterprise value to normal operating profit | 14.50 (11.00 / 16.00) | 14.00 (10.50 / 17.00) | 14.00 (10.00 / 18.00) |
| Net debt | 9,355 (9,464 / 9,373) | 9,793 (9,772 / 9,710) | 9,983 (9,872 / 9,935) |
How much cash does Wynn Resorts really make?
Cash from operations was $1.353 billion in 2025. Capital spending was $660.4 million, leaving conventional free cash flow of $692.2 million. That decline from the previous year came mainly from heavier investment, not from a collapse in operating cash.
Stock compensation does not consume cash immediately, but it gives employees an ownership claim. Treating it as an economic cost reduces 2025 “real” free cash flow to $600.3 million.
| 2025 | 2024 | 2023 | 2022 | 2021 | |
|---|---|---|---|---|---|
| Cash from operations | 1,352,653 | 1,426,203 | 1,247,879 | -71,272 | -222,591 |
| − Capital spending | 660,433 | 419,929 | 442,793 | 300,127 | 290,657 |
| = Free cash flow | 692,220 | 1,006,274 | 805,086 | -371,399 | -513,248 |
| − Stock pay | 91,927 | 59,029 | 64,515 | 67,627 | 95,238 |
| = Real free cash flow | 600,293 | 947,245 | 740,571 | -439,026 | -608,486 |
What this means. The cash spending line excludes equity investments in Wynn Al Marjan Island, so the cash shown as available to shareholders may be higher than the true amount.