Las Vegas Sands earnings date
MyStockButler's October 2026 analysis: Las Vegas Sands’ next results are expected on January 27, 2027. Watch customer spending, especially among high-end patrons.
What has Las Vegas Sands guided for 2027?
Capex means money spent on assets that should last for years, such as hotel rooms, arenas and machinery. The October 21 plan sets capex at $1,487 million in 2026 and $1,950 million in 2027. An annual capex figure is not the full cost of a project: financing, interest and pre-opening expenses can require cash outside that line.
Management’s operating ambition is less precise. Sands China aims to reach $700 million of quarterly adjusted property EBITDA “over time.” EBITDA measures operating earnings before interest, taxes, depreciation and amortization; the adjusted property version also removes specified corporate and other costs. It shows resort performance, not cash available to shareholders. By contrast, management expects the Venetian Macao renovation to be ready by Chinese New Year 2028. The dated construction milestone is firmer than the undated earnings goal.
| the period guided | low | high | the date it was given | |
|---|---|---|---|---|
| LVS Capex Expectations — 2026 | Year to Dec 2026 | 1,487 | 1,487 | Oct 21, 2026 |
| SCL — 2026 | Year to Dec 2026 | 300 | 300 | Oct 21, 2026 |
| Marina Bay Sands Expansion Project — 2026 | Year to Dec 2026 | 450 | 450 | Oct 21, 2026 |
| LVS Capex Expectations — 2027 | Year to Dec 2027 | 1,950 | 1,950 | Oct 21, 2026 |
| Annual Dividend per Share | Year to Dec 2027 | 1.44 | 1.44 | Oct 21, 2026 |
| Dividend per Share per Quarter | Year to Dec 2027 | 0.36 | 0.36 | Oct 21, 2026 |
What this means. The Marina Bay Sands expansion spending is already included in the larger Las Vegas Sands total, so adding both would count some spending twice.
Has Las Vegas Sands kept its past promises?
Sands also followed through on Dumont’s earlier promise to return excess capital. In 2025, it spent US$2,217 million on buybacks, while stock pay was US$54 million. The share count fell from 716.3 million at the end of 2024 to 674.9 million at the end of 2025. Buybacks and stock pay are not the same kind of figure, but the falling share count shows that repurchases outweighed share issuance.
| 2025 | 2024 | 2023 | 2022 | 2021 | |
|---|---|---|---|---|---|
| Stock pay | 54 | 55 | 44 | 39 | 22 |
| Share buybacks | 2,217 | 1,750 | 505 | 0 | 0 |
| Buybacks minus stock pay (calculated) | 2,163 | 1,695 | 461 | -39 | -22 |
| Diluted shares | 693 | 737 | 765 | 764 | 764 |
| Shares outstanding at year end | 674.9 | 716.3 | 753.4 | 764 | 764 |
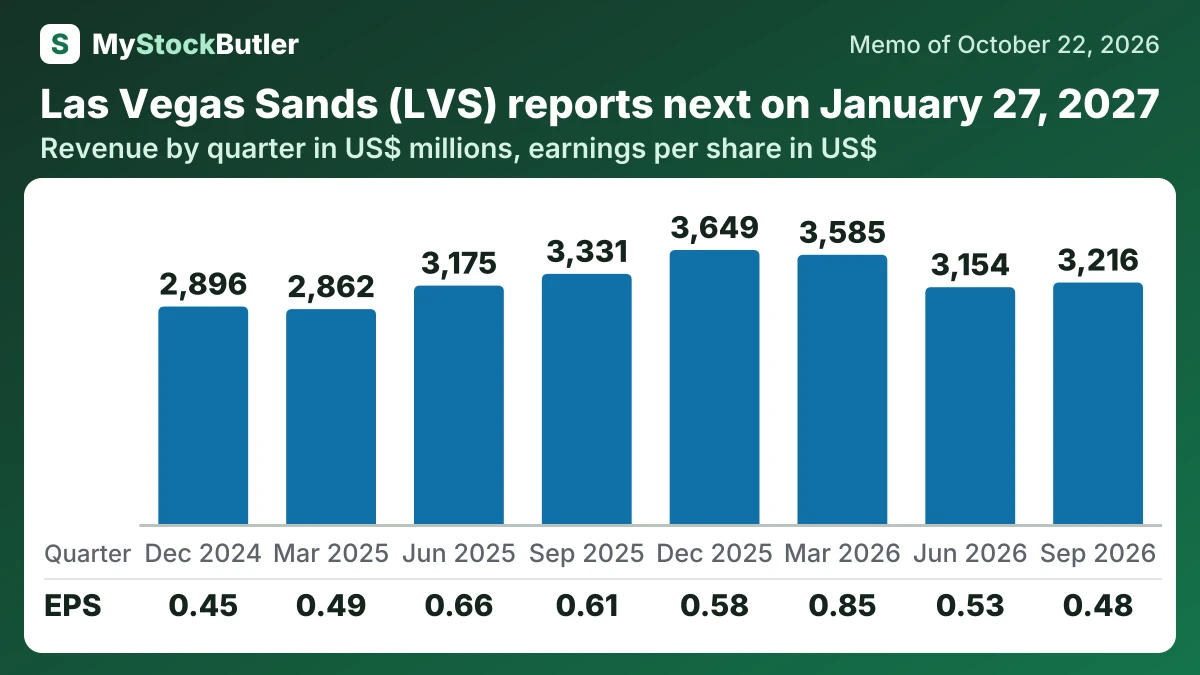
What are Las Vegas Sands’ last eight quarters of revenue and profit?
Revenue, operating income, shareholder net income and diluted EPS all fell from September 2025. Property EBITDA fell to $1,119 million from $1,344 million. Singapore contributed $153 million of the decline, while Macao contributed $72 million.
| Sep 2026 | Jun 2026 | Mar 2026 | Dec 2025 | Sep 2025 | Jun 2025 | Mar 2025 | Dec 2024 | |
|---|---|---|---|---|---|---|---|---|
| Revenue | 3,216 | 3,154 | 3,585 | 3,649 | 3,331 | 3,175 | 2,862 | 2,896 |
| Operating income | 618 | 618 | 904 | 707 | 719 | 783 | 609 | 590 |
| Net income | 304 | 346 | 567 | 395 | 419 | 461 | 352 | 324 |
| EPS, diluted | 0.48 | 0.53 | 0.85 | 0.58 | 0.61 | 0.66 | 0.49 | 0.45 |
What this means. These figures are for each three-month quarter, even though some row descriptions say “year.”
What should Las Vegas Sands watch in the next results?
The December 2026 quarter will test management’s explanation that September’s high-end softness was unusual. Golden Week, entertainment events and normal year-end travel could lift activity, but full rooms and busy gaming floors do not guarantee stronger profits if customers spend less or service costs rise.